2024 Cold Bore Challenge Q&A Thread

solarshooter

Lil-Rokslider
Joined
Jan 17, 2023
Messages
197
Location
WA
I just finished entering all the data. I count 75 entries on the official thread, total 175 shots logged. I tried to capture rifle/ammo details, ranges, and wind speed/direction for each shot (as available). Some quick look stats:
  • Overall, 36/75 (48%) were successful on their first 2 shots
  • 45 claimed an MER <=600yds, of those:
    • 30 (66%) were successful on their first shot
    • 21 (47%) were successful on both shots
  • 30 claimed an MER >600yds, of those:
    • 15 (50%) were successful on their first 2 shots
    • 6 (20%) were successful on their first 3 shots
    • 3 (10%) were successful on all 4 shots
I'll follow up with some deeper looks but I have to run for the day. Super interesting stuff, and good work everyone who participated!
Some more observations:
  • Overall hit rate was 106/175 (61%)
  • At ranges <=600yds, hit rate was 81/124 (65%)
  • At ranges >600yds, hit rate was 25/51 (49%)
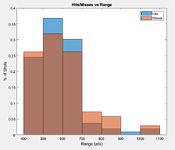
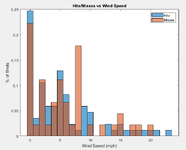
Digging into some correlations, here are histograms showing how hits/misses correlate with range and wind. The trends you'd expect are there - more range and more wind mean more misses, but it's way less significant than I thought it would be. For example, there are still lots of misses in low winds, and lots of hits in high winds. Same with range.

1721196724850.png

1721196760757.png

I will dig into cartridge/energy/BC correlations next.
 

solarshooter

Lil-Rokslider
Joined
Jan 17, 2023
Messages
197
Location
WA
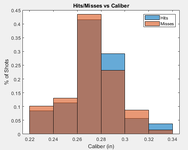
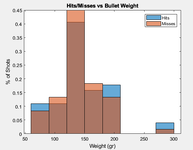
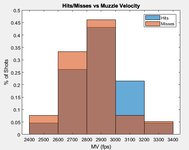
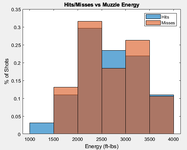
Here are histograms correlating hits/misses with bullet parameters:

1721229399269.png
Larger calibers seemed to have a slight edge over smaller.

1721229423341.png
The heaviest and lightest bullets did the best. Intermediate weights did the worst.

1721229454126.png
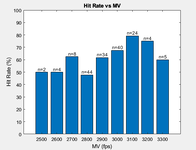
Higher MV seems to correspond with higher hit rate.

1721229487639.png
It's hard to say whether muzzle energy correlated with hit rate at all.
 

solarshooter

Lil-Rokslider
Joined
Jan 17, 2023
Messages
197
Location
WA
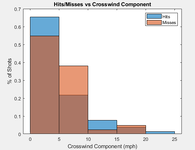
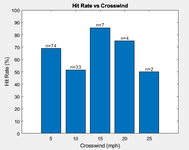
Here's a slightly different version of the histogram of hits/misses vs wind. I calculated crosswind component and and now comparing against that. It tells a cleaner story, basically that very low crosswinds and very high crosswinds had higher success rates, and "medium" crosswinds were the most tricky. I can see how this would be the case, since it's hard to discern say 5 vs 8 mph by feel, whereas a 10+ mph wind is very strong and noticeable and would likely prompt someone to take a measurement with a wind meter. It could also be the case that stronger winds are more directionally consistent, whereas medium winds can tend to be more "switchy". Cool stuff.

1721233132557.png
 
Joined
May 1, 2021
Messages
451
What is the third color in the histograms?
Or, why sometimes blue over brown, sometimes tan over brown?
 

solarshooter

Lil-Rokslider
Joined
Jan 17, 2023
Messages
197
Location
WA
Yeah I should have clarified, these are two separate histograms layered over each other. Red is on top of blue, the overlap ends up brown. Each one has been normalized to # hits or # misses, so each set of blue or red bars will add up to 1. I got this question in a pm too so I'm messing around with other ways to visualize this. Open to suggestions.
 

mxgsfmdpx

WKR
Joined
Oct 22, 2019
Messages
5,192
Location
Outside
Here's a slightly different version of the histogram of hits/misses vs wind. I calculated crosswind component and and now comparing against that. It tells a cleaner story, basically that very low crosswinds and very high crosswinds had higher success rates, and "medium" crosswinds were the most tricky. I can see how this would be the case, since it's hard to discern say 5 vs 8 mph by feel, whereas a 10+ mph wind is very strong and noticeable and would likely prompt someone to take a measurement with a wind meter. It could also be the case that stronger winds are more directionally consistent, whereas medium winds can tend to be more "switchy". Cool stuff.

View attachment 737593
This happens SO often with wind and “wind calls” from folks.

You’re spot on with “medium” winds not being taken into account properly when shooting “long range”. The number of folks who can go out, without an anemometer, and make any accurate wind call above 5 MPH is minuscule.
 

solarshooter

Lil-Rokslider
Joined
Jan 17, 2023
Messages
197
Location
WA
After getting some mixed feedback on previous plots, I took another crack at them. First of all, to recap:
  • 75 entrants, 175 shots logged
  • Overall hit rate was 106/175 (61%)
  • At ranges <=600yds, hit rate was 81/124 (65%)
  • At ranges >600yds, hit rate was 25/51 (49%)
  • Overall, 36/75 (48%) were successful on their first 2 shots
  • 45 claimed an MER <=600yds, of those:
    • 30 (66%) were successful on their first shot
    • 21 (47%) were successful on both shots
  • 30 claimed an MER >600yds, of those:
    • 15 (50%) were successful on their first 2 shots
    • 6 (20%) were successful on their first 3 shots
    • 3 (10%) were successful on all 4 shots
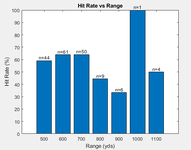
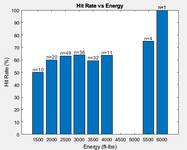
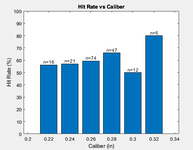
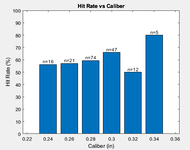
Now for plots. This time we are going to look at Hit Rate (%) vs a variety of variables (x-wind, range, caliber, MV, energy). In all the plots, the x-axis shows "buckets" or ranges of values for that variable. Specifically, the value under a given bar is the top end of the bucket, and the bucket spans from that value to the lower adjacent value. For instance, if I show X hit rate % for the "500" yard range bucket, that really means hit rate for all shots taken from 400-500 yards. "600" will be all shots taken from 500-600 yards, and so on. I also added the number of data points in each bucket on top of each bar, "n=xx", to show where small sample sizes may be skewing the results.

1721666337493.png

1721666360695.png

1721666414617.png

1721666440788.png

Edit: I changed the Hit % vs Caliber plot to be the low end of the bucket, so the labels basically correspond to the caliber in the bucket directly.

1721666763228.png
 

Attachments

  • 1721666386406.png
    1721666386406.png
    15 KB · Views: 12

lak2004

WKR
Joined
Mar 17, 2014
Messages
1,758
Location
SW CO
Looks to me that in general larger calibers, more speed and more energy was slightly helpful.
Those are just making assumptions, though. This is not statistically relevant data. Just observation. If you had the same shooter for multiple calibers in the same conditions, etc. then you could make some useful claims.
 

Geewhiz

WKR
Joined
Aug 6, 2020
Messages
2,400
Location
SW MT
Those are just making assumptions, though. This is not statistically relevant data. Just observation. If you had the same shooter for multiple calibers in the same conditions, etc. then you could make some useful claims.
If there was 1 data point maybe, but there are 175 data points you, can start to see trends and correlations.
 

stan_wa

WKR
Joined
Aug 6, 2020
Messages
313
Location
Washington
Those are just making assumptions, though. This is not statistically relevant data. Just observation. If you had the same shooter for multiple calibers in the same conditions, etc. then you could make some useful claims.
This is why I said “ slightly”

I do agree with you, that more data is good but I think we can clearly conclude that “ smaller did not do way better “ there is not a strong enough trend to say “larger did significantly better”

it seems that gear choices dont drive the outcome too strongly. But if anything higher speed definitely did better
 

lak2004

WKR
Joined
Mar 17, 2014
Messages
1,758
Location
SW CO
This is why I said “ slightly”

I do agree with you, that more data is good but I think we can clearly conclude that “ smaller did not do way better “ there is not a strong enough trend to say “larger did significantly better”

it seems that gear choices dont drive the outcome too strongly. But if anything higher speed definitely did better
I mean, I sucked because I didn't have a good zero before I shot this haha.
 

solarshooter

Lil-Rokslider
Joined
Jan 17, 2023
Messages
197
Location
WA
What’s the hit rate per position? Prone, seated/supported, etc?
I didn't collect that info from the posts. My impression was not alot of that info was provided. If you wanted to make the effort to go through and mine it from each post, I could produce the comparison.
 

Formidilosus

Super Moderator
Shoot2HuntU
Joined
Oct 22, 2014
Messages
9,437
If there was 1 data point maybe, but there are 175 data points you, can start to see trends and correlations.

Negative. If it were 175 points from the same environment and scenario, and the rifles were all controlled for zero, etc- then yes. But here you have 175 random points, from 175 random environments and scenarios. That isn’t “data”.


This is why I said “ slightly”

I do agree with you, that more data is good but I think we can clearly conclude that “ smaller did not do way better “ there is not a strong enough trend to say “larger did significantly better”

it seems that gear choices dont drive the outcome too strongly. But if anything higher speed definitely did better


No. As above- you have 175 random points interspersed from 175 random conditions. By the “data” here- people hit more in 15mph plus winds than they do in very low, to no winds. Which is ludicrous.


The only thing that can be taken from this is that less than 50% hit two first round shots two days back to back. 10% hit that claimed their MER of over 600 yards hit all four shots.

In other words, people suck at shooting and do not know their actual on demand capabilities.
 

solarshooter

Lil-Rokslider
Joined
Jan 17, 2023
Messages
197
Location
WA
Now that the objective part is out of the way, I am going to switch gears and get subjective (and judgemental). To me, the comparisons of hit rate vs caliber etc are burying the lede (my own fault), which is:
  • Overall hit rate was 106/175 (61%)
  • At ranges <=600yds, hit rate was 81/124 (65%)
  • At ranges >600yds, hit rate was 25/51 (49%)
  • 45 claimed an MER <=600yds, of those, 21 (47%) were successful on both shots
  • 30 claimed an MER >600yds, of those, 3 (10%) were successful on all 4 shots
WE SHOULD NOT BE SHOOTING ANIMALS WITH A <50% LIKELY SUCCESS RATE.
 
Last edited:

Geewhiz

WKR
Joined
Aug 6, 2020
Messages
2,400
Location
SW MT
here you have 175 random points, from 175 random environments and scenarios. That isn’t “data”.

Oh boy, I've poked a bear.

Of course It's data, regardless of how seemingly random the data is, you can still develop trends and correlations. If the "not data" matched your narrative I suspect you would call it applicable.
 
Top