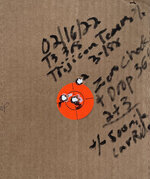
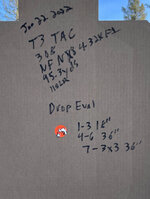
I’m not quite sure what point you are trying to make. That’s not a poke or jab, but a serious question. I don’t understand what your plotting of these groups shows. And how does it prove the tests are invalid in your mind? I’m genuinely trying to understand your pov. I get that you don’t think the sample group is large enough to prove anything definitively and you’re not wrong, but what does this plotting of groups Illustrate?I get it that there are folks on here that have fully bought into the backyard bubba drop tests. For those folks, here's data straight from those drop "tests". More than one were said to have passed and more than one were said to have failed. Tell me why.
As a hint, and because the average American has a 6th grade understanding of mathematics, you should be looking at the mean radius with this itty bitty data set from each scope.
View attachment 460486
I'm all ears....
Navigation
Install the app
How to install the app on iOS
Follow along with the video below to see how to install our site as a web app on your home screen.
Note: This feature may not be available in some browsers.
More options
Style variation
You are using an out of date browser. It may not display this or other websites correctly.
You should upgrade or use an alternative browser.
You should upgrade or use an alternative browser.
Backcountry Rifle Scope
- Thread starter Desert Hntr
- Start date
amassi
WKR
- Joined
- May 26, 2018
- Messages
- 4,218
KYou made it sound like you knew how each scope was tested by those mfg's. Thanks for the one link that shows nothing though, LOL.
Leupold states that "each design" is tested - not each scope.
Sent from my SM-G991U using Tapatalk
Gone4Days
WKR
- Joined
- Oct 29, 2021
- Messages
- 705
I’m surprised it took 5 pages to get here honestly.
You can’t, without context. The “premise and procedure”, as you put it, are precisely what matter and what make those groups tell a story, good or bad, pass or fail. Without context and understanding of what created those groups beforehand, you can draw no conclusions whatsoever, which is why I’m still struggling to understand what point you’re attempting to make. Context matters and you are attempting to prove a point without it.I’m completely putting aside the premise and procedure and everything that goes along with it. We are solely looking at results. If you (the generic you) have bought into the “tests”, the simple question is why are some of those 6 results indicative of a failure and others of a pass? Explain the difference based on the data
I could post pics of a bouquet of roses and it would be no more relevant to this conversation.
You can’t. Pointless to even discuss it. I’ve got no dog in this fight, so I’m done with it. Odd argument.I’m saying we aren’t going to question the how or the why. We’re saying everything is 100% valid, the tests have been performed exactly as described in the sub forum for exactly the reasons why. We don’t need to argue about the “why” or the shooter or the equipment or rest or how the test is ran - none of it. With all of that out of the picture, we can solely focus on results. With that said:
Why are some of those 6 results indicative of a failure and others of a pass? Explain the difference based on the data (which was taken directly from the sub-forum).
- Joined
- Oct 22, 2014
- Messages
- 13,455
I get it that there are folks on here that have fully bought into the backyard bubba drop tests. For those folks, here's data straight from those drop "tests". More than one were said to have passed and more than one were said to have failed. Tell me why.
As a hint, and because the average American has a 6th grade understanding of mathematics, you should be looking at the mean radius with this itty bitty data set from each scope.
View attachment 460486
I'm all ears....
What drop groups are those from?
This scope failed because it had to have a .3 mil adjustment after the drops

And because if this-
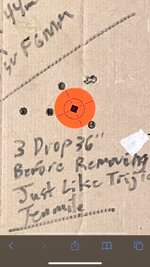
This scope failed.
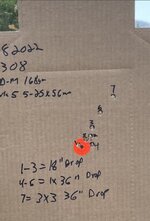
This scope “passed, because the rounds landed inside the cone of the proof group and did not need to be rezeroed afterwards
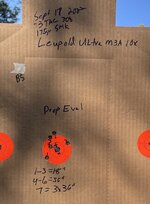
This scope failed-
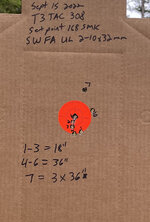
This scope “passed”-

This scope failed-
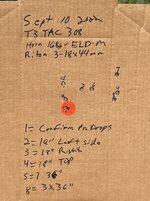
This scope passed-
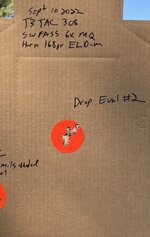
This scope failed-

This scope failed-

Last edited:
- Joined
- Oct 22, 2014
- Messages
- 13,455
- Joined
- Oct 22, 2014
- Messages
- 13,455
Thanks. And those 6 that I’ve asked numerous times about?
All 6 had group sizes (es) that we’re larger than the stated baseline cone. Not all failed though. Several of those 6 didn’t need to be rezeroed, but several did. That metric didn’t correlate to a pass/fail.
I posted the drop groups for each scope evaled in the locked threads. Which ones correlate to what you posted?
Literally anyone can look at those pictures and see which scopes stayed zeroed and which ones didn’t, except the S&B and the Tenmile which would require reading, but that’s ok, I included the screen shot to make it easy.
MTMeatHunter
WKR
TK and Form should get together, beat each other with the TTs and NFs like we know they want to, THEN check zero retention with those scopes.
fwafwow
WKR
- Joined
- Apr 8, 2018
- Messages
- 6,125
Opening caveat - debating or discussing topics on the internet can be a challenge, as the medium makes it hard to determine whether one (or both) “sides” are doing the former or the latter.Thanks. And those 6 that I’ve asked numerous times about?
All 6 had group sizes (es) that we’re larger than the stated baseline cone. Not all failed though. Several of those 6 didn’t need to be rezeroed, but several did. That metric didn’t correlate to a pass/fail.
I’m trying to do the latter. So serious question - is this the answer to your question? If there is more, please let us (me) know. I’m not a math major and I figured out years ago to not try to figure out the answer to a question posed in this manner, unless it’s on a subject with which I’m very familiar. Clearly you know the answer, but - IMHO - when asked in this way, it comes across as more argumentative than perhaps you intended. Same for “bubba drop tests” - but I’m continuing with the hopes that we are all in this thread to learn.
If you have an issue with an aspect (or overall approach) of the drop tests, please just walk us through it. I don’t think Form will take offense and it might facilitate a discussion of how to compare scopes. Maybe it can be improved, or maybe there is a misunderstanding or miscommunication?
I recently tried to describe the drop tests to a friend and he was somewhat skeptical (understandably). What resonated most with him is that in my opinion if scope makers were doing strenuous tests to mimic real world situations, they would make that a central part of their marketing. I’m not familiar with the marketing of all makers, but I’m also not aware of such a front and center marketing pitch, apart from NF. The TT pieces above are new to me, and while those tests are more than I’ve ever seen described for from Swaro (as an example - and I own one), I’m also not informed enough to know how well those tests are for indicating durability.
If one of you (not just @TK-421) has a scope you think would pass the tests, will you send one in for testing? One reasonable response might be “not to some guy on the internet I don’t know”, but short of that, would you consider it?
- Joined
- Oct 22, 2014
- Messages
- 13,455
Why are the results such a mystery to decode? This shouldn’t be hard - especially for you as the person that came up with the test and the person that performs the test.
If you have a defined standard and repeatable procedure, you should be able to take a quick glance, know the “pass”/“fail”, and be able to explain the “because”. If you can’t do that, you’ve got an issue.
What are you talking about? Look at the targets. And again- which ones from your picture correspond to which drop groups?
fwafwow
WKR
- Joined
- Apr 8, 2018
- Messages
- 6,125
More honest questions - is there a deficiency in how he describes the tests and results that prevents you from pointing out how the tests, or results, could be done and decoded in a better way? And if the tests or results are not described fully enough, could one way to approach this discussion be to describe how you would do the tests and explain the outcomes?Why are the results such a mystery to decode? This shouldn’t be hard - especially for you as the person that came up with the test and the person that performs the test.
If you have a defined standard and repeatable procedure, you should be able to take a quick glance, know the “pass”/“fail”, and be able to explain the “because”. If you can’t do that, you’ve got an issue.
- Joined
- Oct 4, 2020
- Messages
- 64
I own three TT scopes, all “P” models; two 5-25 and a 3-15. Am I going to remove them from the guns they sit on and send them to some random on the internet so that he can do an extremely unscientific test with a gajillion variables that aren’t controlled for? Not a chance in hell.Opening caveat - debating or discussing topics on the internet can be a challenge, as the medium makes it hard to determine whether one (or both) “sides” are doing the former or the latter.
I’m trying to do the latter. So serious question - is this the answer to your question? If there is more, please let us (me) know. I’m not a math major and I figured out years ago to not try to figure out the answer to a question posed in this manner, unless it’s on a subject with which I’m very familiar. Clearly you know the answer, but - IMHO - when asked in this way, it comes across as more argumentative than perhaps you intended. Same for “bubba drop tests” - but I’m continuing with the hopes that we are all in this thread to learn.
If you have an issue with an aspect (or overall approach) of the drop tests, please just walk us through it. I don’t think Form will take offense and it might facilitate a discussion of how to compare scopes. Maybe it can be improved, or maybe there is a misunderstanding or miscommunication?
I recently tried to describe the drop tests to a friend and he was somewhat skeptical (understandably). What resonated most with him is that in my opinion if scope makers were doing strenuous tests to mimic real world situations, they would make that a central part of their marketing. I’m not familiar with the marketing of all makers, but I’m also not aware of such a front and center marketing pitch, apart from NF. The TT pieces above are new to me, and while those tests are more than I’ve ever seen described for from Swaro (as an example - and I own one), I’m also not informed enough to know how well those tests are for indicating durability.
If one of you (not just @TK-421) has a scope you think would pass the tests, will you send one in for testing? One reasonable response might be “not to some guy on the internet I don’t know”, but short of that, would you consider it?
But I will tell you this, I’ve hunted with all three of these scopes. During deer season my rifle just rides in the back seat, unloaded and unprotected (not cased). I farm 3500 acres of row crops, so gravel roads and field roads are traveled as much or more than highway. I say this to get the point across that there’s a LOT of bouncing and shaking.
On top of that, two of these guns and scopes recently traveled with me and my wife from Missouri to the north slope of the Brooks range. That was exactly two commercial flights, one charter and one float plane to get to the field. Guns were uncased for the float plane trip.
While on the hunt, with the gun secured in a Kifaru gun bearer, my wife fell, pretty hard, on top of a rock mound. That evening we shot both guns approximately 10 rounds, just killing time and playing, and our furthest shots were 1784 yards. The next day we both killed caribou.
I used to use NF, and really liked them. Out of boredom and chasing weight, I switched to March and had two of them fail; one the erector apparently came loose and tracking was all over the place, and one the reticle became canted.
After that I switched to Swaro X5i’s and really liked them, but hated their goofy ass tool for adjusting the knobs.
So after researching, I went with TT, and am damn glad I did. The ones I own have proven to me to be extremely reliable in the manner in which my wife and I hunt and shoot.
Just my .02
fwafwow
WKR
- Joined
- Apr 8, 2018
- Messages
- 6,125
Understood/understand. Is this because you (a) don’t want to take a rifle out of commission, or (b) worry that the scope won’t be returned, or may be damaged? If so, I get the view - but perhaps (a) could be ameliorated depending on hunting seasons or uses, and (b) could be addressed following more time seeing RS interactions, or vouches from folks. Maybe.I own three TT scopes, all “P” models; two 5-25 and a 3-15. Am I going to remove them from the guns they sit on and send them to some random on the internet so that he can do an extremely unscientific test with a gajillion variables that aren’t controlled for? Not a chance in hell.
If instead you are questioning the variables and the methodology, then I don’t understand the concern. If you get past (a) and (b), and you then don’t like the outcome of the tests, you are free to ignore them.
But I will tell you this, I’ve hunted with all three of these scopes. During deer season my rifle just rides in the back seat, unloaded and unprotected (not cased). I farm 3500 acres of row crops, so gravel roads and field roads are traveled as much or more than highway. I say this to get the point across that there’s a LOT of bouncing and shaking.
On top of that, two of these guns and scopes recently traveled with me and my wife from Missouri to the north slope of the Brooks range. That was exactly two commercial flights, one charter and one float plane to get to the field. Guns were uncased for the float plane trip.
While on the hunt, with the gun secured in a Kifaru gun bearer, my wife fell, pretty hard, on top of a rock mound. That evening we shot both guns approximately 10 rounds, just killing time and playing, and our furthest shots were 1784 yards. The next day we both killed caribou.
These are anecdotes, but in the absence of a uniform industry standard, still helpful. I think Form is trying to come up with something in a void that exists - and if there is a better way to test by consumers, then please make suggestions.
- Joined
- Oct 22, 2014
- Messages
- 13,455
I don’t know how to make it much simpler.
You developed your standard.
You developed your procedure to test.
You executed your procedure.
You (and others) can’t recognize the difference between a pass or a fail based on your own results.
I’ve performed material testing professionally in the private sector. Wrote testing and performance specs. Worked with various govt agencies/departments. It’s never this hard. Ever.
I can take a quick look at any of the results of the legitimate standardized (and repeatable) tests that I’ve been involved in and go into more detail than anyone cares about. Having 6 results lined up next to each other would be extremely helpful and easy to explain the nuances, differences, similarities to the layperson.
Which targets correspond to your picture?
ResearchinStuff
WKR
One outcome is not more statistically significant than another outcome. That’s not how it works at all and why a sufficient sample size is is required to try and evaluate the population. Let’s be honest, that’s explained within about the first hour of the first class of any Stat 101.
When quality control systems are in effect, pass/fail outcomes of finished products are not a coin toss. Finding a defective part is a big deal, and here's why:
If a company is actually achieving six sigma quality, that means 3.4 expected failures per million opportunities, or 99.9997% chance of a defect free product. Most of these scopes have way less than 1 million units in circulation, so if the design is adequate, then there should be less than 3 faulty units (unable to hold zero or maintain constant poi) in existence. Make less than 333,000 units and the number of defective units should be zero.
So, what is the probability that one random dude who actually cares enough to check (there's 3 on the planet that I know of, me, form and sndman11) ended up with one of those units? 3/(8billion) * 0.000003 = 1.125x10^-15.
For anyone else still reading, the probability of winning the powerball jackpot on one ticket is around 3x10^-9. The odds of form getting a defective scope at random are a million times lower than that.
That's why a failed test result does have meaning, while a pass test doesn't. If the design is solid the scopes will pass.
Now consider the odds that same guy gets another scope that doesn't function right, from a different design and distribution system, a fully independent event. 10^-30 odds of that happening. What's your personal probability threshold for impossibility?
Form has revealed a major defect in scope engineering design. Most can easily see that from the targets.
- Joined
- Oct 4, 2020
- Messages
- 64
If you think for a second that I’m beholden to you to explain why I don’t want to send my scope to a stranger so that he can drop it, you’re very mistaken.Understood/understand. Is this because you (a) don’t want to take a rifle out of commission, or (b) worry that the scope won’t be returned, or may be damaged? If so, I get the view - but perhaps (a) could be ameliorated depending on hunting seasons or uses, and (b) could be addressed following more time seeing RS interactions, or vouches from folks. Maybe.
If instead you are questioning the variables and the methodology, then I don’t understand the concern. If you get past (a) and (b), and you then don’t like the outcome of the tests, you are free to ignore them.
These are anecdotes, but in the absence of a uniform industry standard, still helpful. I think Form is trying to come up with something in a void that exists - and if there is a better way to test by consumers, then please make suggestions.
If it concerns you so much, buy one of your own and send it to the guy. But please stop acting like I or anyone else has to answer your questions about why we won’t send our scopes for a backyard scope drop and sight in session.
My equipment only has to work for me. It has been flawless thus far.
 If it fails to do the job or something better or more interesting catches my eye, then I’ll change. Until then, I’m quite happy in my choice for long range hunting optics.
fwafwow
WKR
- Joined
- Apr 8, 2018
- Messages
- 6,125
Sorry, I didn't intend to imply that you are beholden to anyone, for anything. You said you would never do it, and my questions were honest questions about why you would have that view. I even crafted my question with one reason that makes complete sense to me - that you don't know the guy. If you are reading more into my post than that, I apologize - but maybe read it again and my prior posts in which I'm trying to bend over backward in this discussion/debate to get to a civil discourse on varying viewpoints.If you think for a second that I’m beholden to you to explain why I don’t want to send my scope to a stranger so that he can drop it, you’re very mistaken.
If it concerns you so much, buy one of your own and send it to the guy.
I did.
No one has to answer anyone's questions. Just asking a question in my opinion doesn't mean anything more than that. But I do get information from all threads in which people ask each other questions - whether they are answered or not.But please stop acting like I or anyone else has to answer your questions about why we won’t send our scopes for a backyard scope drop and sight in session.
fwafwow
WKR
- Joined
- Apr 8, 2018
- Messages
- 6,125
Thanks.I hear ya - tone conveys poorly on the internet, and it seems like a lot of people are looking for reasons to get offended nowadays. This isn’t an argument for me.
There’s been a few threads going into the premise and procedure behind the tests. It even bled over into SnipersHide at one point. Basically, it became more about personalities than anything else, and believers wanted to believe.
There’s an entire profession behind true QC testing. Guess what, they don’t batch test based on a single sample. That’s not how it works.
I am not in the same profession, but I think I get it. In the absence of having many samples, how would you encourage testing to be done? And does the point @ResearchinStuff made about fails vs. passes make sense, especially since any testing done outside of the manufacturer mean the sample size will be extremely small?
Now that you mentioned it, I think I commented on your scope test, and you never responded. Were the targets shot at 15 yards like you stated in the OP? Were those red circles 1”? I think that would’ve resulted in something like 8 or 10+ MOA groups if I remember correctly. I took your silence as an affirmation.
Similar threads
- Replies
- 0
- Views
- 132
- Replies
- 20
- Views
- 2K
Featured Video
Latest Articles
- TT#64 Josh Boyd Elk Hunting Strategies for Every Season
- Aaron Davidson of Gunwerks
- TT#63 Dirk Durham’s Art of Elk Calling
- BIG Buck Stories with the Dirty Giants Podcast
- TT#62 Brian Barney Hunting Bulls without Calling
- Hoyt Alpha AX-2 SD Review
- Kuiu Kenai vs Outdoor Vitals Vario Hooded Jacket Review
- Hoyt RX-9 Ultra Review
- Hunting Vampire Bucks & Building an Optics Kit
- Darton Sequel ST2 35 Review


