New Mexico Big Game Draw Simulator

Bigeaux20

FNG
Joined
Oct 3, 2018
Location
Louisiana
Alright, let’s slow this down for a minute and talk about something that’s been rattling around in my head. Picture this: I’m just a flatlander, born and raised east of the Mississippi. Where I come from, the ground’s not just flat—it’s soft, forgiving. Nothing like the rugged terrain you folks out west deal with. Now, I’ve been trying to wrap my head around this big game draw system—trying to crack the code, you know? And me, being a little bit of a numbers guy—okay, maybe a numbers nerd if I’m being honest—I started wondering: what if there’s a better way to get a feel for this?

They say experience is the best teacher, right? But who’s got the time—or the tags—to rack up decades of draw experience? So I thought, why not create a way to fast-track that? I'm not a program writer or coder or whatever you call it. I'm just a guy who spends too much time obsessing about this stuff. What if I could run a simulation—multiple draws, over and over—until the patterns start showing themselves and somehow make sense of what these "draw odds" really mean? That’s where this idea came from. My approach was if I made these three selections, and simulated the draw, how many times would I win. Here's something I didn't expect. If the odds are 4%, the simulation results weren't 4 times out of 100. It's astonishing.

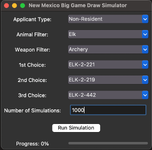
I took past draw data—real numbers, real outcomes—and built something that creates a random pool of applicants, just like the real thing and with the same strategies and tendencies. Then it adds your choices into the mix and runs the draw as many times as you want. One simulation? Sure. Ten? Why not. A hundred? A thousand? Now we’re talking.
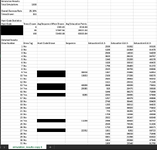
And here’s the kicker—it’s built to mimic how the New Mexico Big Game draw actually works. Random sequence, choice-based, the whole deal. And you can run it for any animal in the draw, any hunt code, any weapon, and any category of resident, non-resident, or outfitter. In the end it's spits out a spreadsheet that gives some interesting information. I’ve got some examples here, some screenshots to show you what it looks like in action. I did all this as a personal tool, but I’m even kicking around the idea of putting this online, maybe a website where anyone can use it. But here’s where I need you—I’m not too proud to ask for help. What do you think? Is this something that’d be useful to you? Something worth digging into deeper? I’m all ears—lay it on me. Is there something here? Pick it apart. What makes you interested or skeptical?
 

Attachments

  • Screenshot 2025-03-11 at 10.40.06 AM.png
    Screenshot 2025-03-11 at 10.40.06 AM.png
    205.8 KB · Views: 99
  • Screenshot 2025-03-11 at 10.54.16 AM.png
    Screenshot 2025-03-11 at 10.54.16 AM.png
    93.2 KB · Views: 98
Interesting. How is this different than the products already offered by go hunt / onx? Personally, I just prefer to use the spreadsheet odds for worse case scenario. What insights does running the simulation provide?
 
I was just thinking we needed a new way to know for certain we weren't getting that tag. :p

Anyway, to my knowledge this is how GoHunt derives their odds...it's a compilation of historical inputs through thousands of simulations and then odds calculated.
 
Interesting. How is this different than the products already offered by go hunt / onx? Personally, I just prefer to use the spreadsheet odds for worse case scenario. What insights does running the simulation provide?
Hey, so here’s the deal—and I’m just gonna lay it out like I see it. I’ve got ONX Elite, GoHunt, Huntin’ Fool, all of ‘em. I’m paying for the whole stack, right? And this thing I’m working on? It’s not about replacing what they do. I’m not sitting here saying, “Oh, this is the silver bullet they’re all missing.” I’m not that guy. I think it’s different—maybe even better—but I don’t know that yet. What’s the real gap between a 5% shot and a 2.8% shot? I mean, what’s that feel like to someone who’s just trying to figure this game out? You tell me—does flipping the order of your picks actually teach you anything worth knowing?
Here’s where I’m at: the draw’s personal. It’s about what you want. You’re swinging for the fences? Cool—load up three dream hunts, and if one lands, you’re golden. But let’s talk numbers for a sec. Last big game draw had, what, 240,000 people in the mix? Now imagine this: for one unit, you’ve gotta be in the first 2,000 pulled to snag a tag. The next one? First 10,000. Does that shift how you’d play it? Am I crazy for thinking that matters? I’m trying to spread my bets—cover some ground—but still chase a unit worth hunting. Maybe I’m overcomplicating it. Maybe this is a total waste of time. You’d tell me if I’m off base, right?
So here’s my ask: would it help if I showed you? Like, a quick demo—or I could just drop the report here and let you poke at it. What’s your gut say?
 
The New Mexico odds are deflating. I keep thinking how awesome it would be to draw a tag, then you do some research and only a very small handful of the tags are really worth the long odds.

Less than 10 percent odds to draw pretty much any archery tag that you’ve got a ~10-20% chance of punching, and you’re a fool for holding out for a 300” bull on more than a handful of units.

I’m still going to apply but really questioning if the juice is worth the squeeze. There’s plenty of places to get your s*** pushed in that aren’t hard to draw.


Sent from my iPhone using Tapatalk
 
So now I can get rejected in a simulated draw AND the real thing! Simulated disappointment before real disappointment 😂
Need to add red background to the results, then it’ll match the real thing.
Hey, you know, maybe that’s why online poker’s got such a hook—you get all the gut punches, but at least you’re not signing over the deed to your house, right? Me? I’m just over here trying to crack the code, learn something useful while I’m at it. I’m wide open to how this shakes out. Here’s a thought: what if I could run your picks through the grinder—say, 1,000 times—and show you where the chips fall? Like, you’re sitting at #8,000 in line, but the hunts you’re eyeing? Gone by #5,000. Does that hit different for you? I’m not saying it’s the holy grail—it’s just a slant, a little twist on the usual way of seeing it. You tell me—what’s off about that? Where am I missing the mark?
Same deal’s on the table: you want me to run a demo with your choices, see what pops up? Could be kinda revealing. I’d be happy to shoot it over in an email—keep it between us, no need to air it out for the world. What do you think—worth a look?
 
I was just thinking we needed a new way to know for certain we weren't getting that tag. :p

Anyway, to my knowledge this is how GoHunt derives their odds...it's a compilation of historical inputs through thousands of simulations and then odds calculated.
Hey, so here’s where I’m getting tangled up—and maybe you’ve already got this wired, but I’m still wrestling with it. What do those odds even mean in real life? Say you’ve got 5 tags up for grabs, 100 people throwing their hat in the ring. Simple math says 5%, right? That’s the easy part. But then I look closer, and somehow it’s showing up like 10% odds. How’s that jump happening? I’m thinking—what if 75 of those folks have that hunt code buried as their third pick? Does that mean there’s, what, a 66% shot they never even sniff that third choice? I’m not saying I’ve cracked it—I’m more the type to grind it out, feel the pieces click. You guys might already have this dialed, so bear with me.
Here’s what’s throwing me off: if the odds are sitting at 10%, and I run a random simulation—1,000 spins, shuffling the applicants every 5 draws, 5 simulations per draw—why’s that hunt code popping up more than 10% of the time on average? It may come up 35% of the time. Does that mean anything either? I’m not kidding around here—what am I not seeing? You tell me: where’s the disconnect? I’m all ears.
 
My instinct tells me that this would be the way to quickly estimate overall odds of success in New Mexico:

P_overall = 1 – (1 – P_1) • (1 – P_2) • (1 – P_3)​

where P_1, P_2, P_3 are your odds of success (based on the draw report) for choices 1, 2, 3 respectively.

Example: If my 3 choices have individual draw odds of 3% (e.g., 100 applicants last year for that tag with 3 successful), 4%, and 5%, my overall odds of drawing 1 of the 3 would be 1 – (1 – .03) • (1 – .04) • (1 – .05) = 11.5%

This method works to compute overall odds of a single result over a series of independent events of known individual probabilities (e.g., repeatedly rolling dice). The New Mexico draw is a bit more complicated than rolling dice, but my gut says this method would get you close. How does this method compare to your simulation?
 
The New Mexico odds are deflating. I keep thinking how awesome it would be to draw a tag, then you do some research and only a very small handful of the tags are really worth the long odds.

Less than 10 percent odds to draw pretty much any archery tag that you’ve got a ~10-20% chance of punching, and you’re a fool for holding out for a 300” bull on more than a handful of units.

I’m still going to apply but really questioning if the juice is worth the squeeze. There’s plenty of places to get your s*** pushed in that aren’t hard to draw.


Sent from my iPhone using Tapatalk
Hey, you’re hitting right where I’m at. I’m putting in either way—gotta play to win, right? But how do I make sure I end up somewhere that’s worth the trip? That’s the itch I’m scratching. All this data floating around—ONX, GoHunt, the works—it’s gotta be worth something, I’d think. So how do we crack it open? How do we sift through it and figure out if there’s more to pull out—something that actually moves the needle? You tell me—what’s your gut saying about how we turn that pile of numbers into a real edge?
 
My instinct tells me that this would be the way to quickly estimate overall odds of success in New Mexico:

P_overall = 1 – (1 – P_1) • (1 – P_2) • (1 – P_3)​

where P_1, P_2, P_3 are your odds of success (based on the draw report) for choices 1, 2, 3 respectively.

Example: If my 3 choices have individual draw odds of 3% (e.g., 100 applicants last year for that tag with 3 successful), 4%, and 5%, my overall odds of drawing 1 of the 3 would be 1 – (1 – .03) • (1 – .04) • (1 – .05) = 11.5%

How does this method compare to your simulation? I haven’t given this much deep thought, so my off-the-cuff guess may be way off.
Hey, I love where you’re going with this—it’s got me hooked. But here’s what I’m chewing on: is that relationship as straight-line as the formula wants us to think? Picture it like this: what are the odds you even get a seat at the table to begin with? That’s the real kicker. The trouble with leaning hard into a direct odds calculation is—it’s banking on you being in the game, guaranteed. But here’s where it gets messy, and I’ll admit I’m not sharp enough to crunch it in my head or spit out the theory on the fly: the odds aren’t just 100 names in a hat, first three get the prize. It’s way more fluid than that, right? If everyone’s locked in on first choices, sure, plug and play—it’s clean. But those picks? They’re smeared across first, second, third choices. And when you strip it down, doesn’t it all hinge on where you land in the draw order? You’re #1? Boom, your first choice is yours, no sweat. I’ve got a hunch most folks are wiring their brains this way when they apply—am I off on that?
So here’s my question for you—and I’m leaning on you here because you seem to dance with numbers better than I do: how does that shift your approach? What’s it make you rethink?
 
Hey, so here’s the deal—and I’m just gonna lay it out like I see it. I’ve got ONX Elite, GoHunt, Huntin’ Fool, all of ‘em. I’m paying for the whole stack, right? And this thing I’m working on? It’s not about replacing what they do. I’m not sitting here saying, “Oh, this is the silver bullet they’re all missing.” I’m not that guy. I think it’s different—maybe even better—but I don’t know that yet. What’s the real gap between a 5% shot and a 2.8% shot? I mean, what’s that feel like to someone who’s just trying to figure this game out? You tell me—does flipping the order of your picks actually teach you anything worth knowing?
Here’s where I’m at: the draw’s personal. It’s about what you want. You’re swinging for the fences? Cool—load up three dream hunts, and if one lands, you’re golden. But let’s talk numbers for a sec. Last big game draw had, what, 240,000 people in the mix? Now imagine this: for one unit, you’ve gotta be in the first 2,000 pulled to snag a tag. The next one? First 10,000. Does that shift how you’d play it? Am I crazy for thinking that matters? I’m trying to spread my bets—cover some ground—but still chase a unit worth hunting. Maybe I’m overcomplicating it. Maybe this is a total waste of time. You’d tell me if I’m off base, right?
So here’s my ask: would it help if I showed you? Like, a quick demo—or I could just drop the report here and let you poke at it. What’s your gut say?
I'd be interested in checking it out. As a guy who's researched the odds and used the different products over the last decade, it doesn't matter whether you run straight odds, a draw simulator or weight 2nd and 3rd choices as folks leave the pool on an earlier choice. They all give you an idea of relative odds b/w hunts. Imo, it comes down to the individuals draw strategy and where they're drawn in the stack.

We're at the point now where everyone knows about draw odds calculators and there's very few secrets anymore. Odds across the board have decreased. More informed applicants, generally speaking. I think Toprut was the best commercial product going and sad to see it go.

Beyond another calculator or simulator, the most interesting thing to me would be a tool that predicts human behavior. What are people putting in for this year based on the odds published last year? Two years ago? How does the popularity or naming of a unit impact the odds? Availability of online information on a unit? Can that be predicted/accounted for?
 
Hey, so here’s where I’m getting tangled up—and maybe you’ve already got this wired, but I’m still wrestling with it. What do those odds even mean in real life? Say you’ve got 5 tags up for grabs, 100 people throwing their hat in the ring. Simple math says 5%, right? That’s the easy part. But then I look closer, and somehow it’s showing up like 10% odds. How’s that jump happening? I’m thinking—what if 75 of those folks have that hunt code buried as their third pick? Does that mean there’s, what, a 66% shot they never even sniff that third choice? I’m not saying I’ve cracked it—I’m more the type to grind it out, feel the pieces click. You guys might already have this dialed, so bear with me.
Here’s what’s throwing me off: if the odds are sitting at 10%, and I run a random simulation—1,000 spins, shuffling the applicants every 5 draws, 5 simulations per draw—why’s that hunt code popping up more than 10% of the time on average? It may come up 35% of the time. Does that mean anything either? I’m not kidding around here—what am I not seeing? You tell me: where’s the disconnect? I’m all ears.

Your inputs are not aligned with reality.

I'm not even certain the full draw mechanics are publicly known and/or published. I do think GoHunt has an insider track and is able to consider all of the mechanics and inputs.
 
To be more helpful here is an example.

Unless this has changed, when I last looked I could not determine if New Mexico runs one draw that sequences resident, non-resident, and outfitted hunters, or if it is two or even three separate draws. The way the results shake out to me I have to conclude it's one draw and everyone is pooled and sequence is set and tags are awarded, and once outfitted hunters and non-residents hit their maximum allotment they are ignored. But I don't know that for fact. Your simulator would have to know that for fact to be accurate. You would also have to know how many people apply in all three pools.
 
To the OP, some old information to consider that still applies to what you are exploring:


As to your question about using the #s to your advantage, I think the best/only strategy is to take the long view. Over many, many years and multiple apps per year, optimize for probability.

Most people think there is no meaningful difference between 2% and 4% odds, and on a single app I may tend to agree (mostly). But think of it as 1 in 50, vs 1 in 25. You are literally twice as likely to draw the 4% app. You still probably aren't drawing either tag this year - but over 10s of years and 100s of apps, such an approach can pay dividends.
 
Back
Top