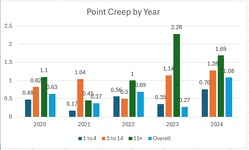
I crunched some more numbers on
point creep. I only included archery units/tags because I didn't feel like spending an eternity compiling data.
What I'm trying to find is the average number of points needed to draw. This is a weighted average because I factored in the number of tags given for each unit.
I classified the level of the unit based on how many points it took to draw in 2023.
0 Points: Zero
1-4 Points: Low
5-14 Points: Mid
15+ Points: High
The chart below shows every single unit from 2019-2023. You can see the average number of points DECREASED from 2019 (needed an average of 1.67 points to draw) to 2023 (needed an average of 0.76 points to draw. This is because a large number of tags went from OTC to draw and these units have been drawing at zero points. Because this is weighted, it is skewing the data.
View attachment 718665
The next chart shows all the units EXCEPT the zero point units. I believe this is a better representation of the overall point creep for Colorado archery tags. On average, each unit is creeping 0.49 points per year.
View attachment 718666
This chart shows only low units that required 1-4 points to draw in 2023. On average, these units are creeping 0.39 points per year.
View attachment 718668
This chart shows only the mid units that required 5-14 points to draw in 2023. On average, these units are creeping 0.875 points per year.
View attachment 718669
The last chart shows only the high units that required 15+ points to draw in 2023. On average, these units are creeping 1.2075 points per year.
View attachment 718670
I'll let you all draw your own conclusion.
I'd love to add 2024 data to this because then we can see how to R/NR allocation change has shifted the data. Additionally, I love to add data before 2019 so we can understand what point creep was like before COVID. However, I already spent too much time compiling data. Maybe some day I'll add more!

