2024 co elk recaps

sambo3006

Lil-Rokslider
Joined
Aug 26, 2021
Messages
102
Location
Missouri
I used 14 NR points on a second season bull hunt that drew out at 6 points last year. It drew out at 8 points this year. I knew I was never going to catch up to the next higher tier of hunts, and my vacation time lined up perfectly for a second season hunt this year. I did the same thing a couple of years ago on a third season deer hunt. I burned 9 points on a hunt that drew out at 6 points. I killed a nice buck on that hunt and was very happy.
The unit I drew this year doesn't have antler point restrictions on bulls. I would love to shoot a 6x6, and won't pass up any 6x6 bull unless it is truly tiny. However, I am going to temper my expectations and will take what the mountain gives me, even if it is a small bull later in the hunt. These 14 points won't get me a hunt near as good as the 12 points I used in Utah in 2016, where I passed up 14 different bulls and killed a huge bodied 320" 6x6. It is what it is. Any bull elk is huge compared to the whitetails I shoot in Missouri.
Congratulations and good luck to all who drew this year!
Sam

 

bz_711

WKR
Joined
May 7, 2012
Messages
832

For the units I follow I can definitely see the impact of reduced NR allocation. Did this help keep the resident PP required flat or drop at all?

Going to get wild next year if all OTC is gone and you now have to burn all PP if you don't want to risk relying on a 2nd Choice.

Regardless - I'm heading to CO again with my bow to chase elk this year...always exciting. Good Luck to everyone!
 

sndmn11

"DADDY"
Joined
Mar 28, 2017
Messages
10,778
Location
Morrison, Colorado
For the units I follow I can definitely see the impact of reduced NR allocation. Did this help keep the resident PP required flat or drop at all?

Overall, my family drew more tags than expected as second choice, and all we expected for first choice. The second choices aren't influenced by the new allocation though because everyone goes to the same spot after the first choice (I think).

The hunt codes I keep track of didn't seem to creep, but they have been flat for a few years.
 

Jethro

WKR
Joined
Mar 2, 2014
Messages
1,469
Location
Pennsylvania
Had to help just by the math. Enough to see it in the points required column??? Maybe not.

Looks like adult resident 1st choice draw odds went up about 4% vs 2023. Can’t pinpoint that solely to the new quota split though.

Edit add: this is elk
 
Last edited:

Jethro

WKR
Joined
Mar 2, 2014
Messages
1,469
Location
Pennsylvania
The number that really jumps out to me is the number applying for points as their first choice. Almost 122k. Up about 30k since 2020. That’s as far back as I track. Clearly people not bailing out of the game. For elk
 

tboltz34

FNG
Joined
Nov 18, 2020
Messages
34
Location
Minnesota
For the data nerds like me.

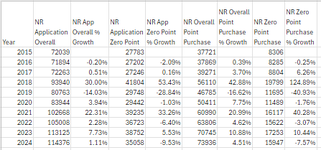
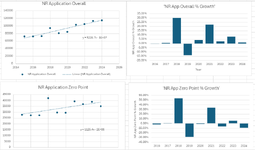
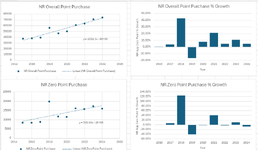
I charted the NRs elk draw recap data since 2015. The data does not show anything surprising. Overall demand is up with the biggest increase in 2021 (Covid), other than 2018 (not sure what happened here). One thing to note is this data does not consider OTC sales. Since some OTC units have been converted to draw units, the overall demand increase may be misleading since the number of OTC units has decreased and the number of draw units has increased. Again, only draw data is being represented.

Data being tracked:
  • NR Application Overall- This is the number of NRs applying
  • NR App Overall % Growth- YoY percentage increase of NRs applying
  • NR Application Zero Point- This is the number of NRs that applied with zero points
  • NR App Zero Point % Growth - YoY percentage increase of NRs applying with zero points
  • NR Overall Point Purchase- This is the number of NRs who purchased a point
  • NR Overall Point Purchase % Growth- YoY percentage increase of NRs who purchase a point
  • NR Zero Point Purchase- This is the number of NRs who purchased a point without having points
  • NR Zero Point Purchase % Growth - YoY percentage increase of NRs who purchased a point without having points

Conclusions:
  • Overall demand is up.
  • Points being purchased (1.96x increase since 2015) is growing faster than number of applications (1.59x increase since 2015).
Predictions:
  • Demand is at it's peak- number of applications is up slightly for 2024, but the number of people entering at zero points has decreased.
  • Number of applications will decrease within the next year or two (assuming the number of draw units does not change- not likely).


1717169505287.png


1717170404910.png
1717170428986.png
 
Last edited:

Dave_

Lil-Rokslider
Joined
Mar 3, 2017
Messages
173
Location
Austin, TX
For the data nerds like me.

I charted the NRs elk draw recap data since 2015. The data does not show anything surprising. Overall demand is up with the biggest increase in 2021 (Covid), other than 2018 (not sure what happened here). One thing to note is this data does not consider OTC sales. Since some OTC units have been converted to draw units, the overall demand increase may be misleading since the number of OTC units has decreased and the number of draw units has increased. Again, only draw data is being represented.

Data being tracked:
  • NR Application Overall- This is the number of NRs applying
  • NR App Overall % Growth- YoY percentage increase of NRs applying
  • NR Application Zero Point- This is the number of NRs that applied with zero points
  • NR App Zero Point % Growth - YoY percentage increase of NRs applying with zero points
  • NR Overall Point Purchase- This is the number of NRs who purchased a point
  • NR Overall Point Purchase % Growth- YoY percentage increase of NRs who purchase a point
  • NR Zero Point Purchase- This is the number of NRs who purchased a point without having points
  • NR Zero Point Purchase % Growth - YoY percentage increase of NRs who purchased a point without having points

Conclusions:
  • Overall demand is up.
  • Points being purchased (1.96x increase since 2015) is growing faster than number of applications (1.59x increase since 2015).
Predictions:
  • Demand is at it's peak- number of applications is up slightly for 2024, but the number of people entering at zero points has decreased.
  • Number of applications will decrease within the next year or two (assuming the number of draw units does not change- not likely).


View attachment 718505


View attachment 718511
View attachment 718512
2018 was the year they stopped charging full tag price at time of application. So super cheap to just put in for points. I think there were a few other changes to the draw system that year also

Sent from my SM-G975U using Tapatalk
 

tboltz34

FNG
Joined
Nov 18, 2020
Messages
34
Location
Minnesota
2018 was the year they stopped charging full tag price at time of application. So super cheap to just put in for points. I think there were a few other changes to the draw system that year also

Sent from my SM-G975U using Tapatalk
That makes a lot of sense. I appreciate the insight, Dave!
 

11boo

WKR
Joined
Feb 24, 2016
Messages
2,469
Location
Grand Jct, CO
For the data nerds like me.

I charted the NRs elk draw recap data since 2015. The data does not show anything surprising. Overall demand is up with the biggest increase in 2021 (Covid), other than 2018 (not sure what happened here). One thing to note is this data does not consider OTC sales. Since some OTC units have been converted to draw units, the overall demand increase may be misleading since the number of OTC units has decreased and the number of draw units has increased. Again, only draw data is being represented.

Data being tracked:
  • NR Application Overall- This is the number of NRs applying
  • NR App Overall % Growth- YoY percentage increase of NRs applying
  • NR Application Zero Point- This is the number of NRs that applied with zero points
  • NR App Zero Point % Growth - YoY percentage increase of NRs applying with zero points
  • NR Overall Point Purchase- This is the number of NRs who purchased a point
  • NR Overall Point Purchase % Growth- YoY percentage increase of NRs who purchase a point
  • NR Zero Point Purchase- This is the number of NRs who purchased a point without having points
  • NR Zero Point Purchase % Growth - YoY percentage increase of NRs who purchased a point without having points

Conclusions:
  • Overall demand is up.
  • Points being purchased (1.96x increase since 2015) is growing faster than number of applications (1.59x increase since 2015).
Predictions:
  • Demand is at it's peak- number of applications is up slightly for 2024, but the number of people entering at zero points has decreased.
  • Number of applications will decrease within the next year or two (assuming the number of draw units does not change- not likely).


View attachment 718505


View attachment 718511
View attachment 718512
Thank you for sharing that.
 
Joined
May 28, 2013
Messages
1,683
Location
Littleton, CO
Like mentioned above 2018 stopped collecting full price up front. They also had no qualifying license requirement that got implemented in 2019. They also got rid of the $40 preference point fees for elk/deer/bear/pronghorn and implemented $50RES/$100NR PP fees for moose/goat/sheep.
 

RyanT26

WKR
Joined
Apr 8, 2020
Messages
1,336
For the data nerds like me.

I charted the NRs elk draw recap data since 2015. The data does not show anything surprising. Overall demand is up with the biggest increase in 2021 (Covid), other than 2018 (not sure what happened here). One thing to note is this data does not consider OTC sales. Since some OTC units have been converted to draw units, the overall demand increase may be misleading since the number of OTC units has decreased and the number of draw units has increased. Again, only draw data is being represented.

Data being tracked:
  • NR Application Overall- This is the number of NRs applying
  • NR App Overall % Growth- YoY percentage increase of NRs applying
  • NR Application Zero Point- This is the number of NRs that applied with zero points
  • NR App Zero Point % Growth - YoY percentage increase of NRs applying with zero points
  • NR Overall Point Purchase- This is the number of NRs who purchased a point
  • NR Overall Point Purchase % Growth- YoY percentage increase of NRs who purchase a point
  • NR Zero Point Purchase- This is the number of NRs who purchased a point without having points
  • NR Zero Point Purchase % Growth - YoY percentage increase of NRs who purchased a point without having points

Conclusions:
  • Overall demand is up.
  • Points being purchased (1.96x increase since 2015) is growing faster than number of applications (1.59x increase since 2015).
Predictions:
  • Demand is at it's peak- number of applications is up slightly for 2024, but the number of people entering at zero points has decreased.
  • Number of applications will decrease within the next year or two (assuming the number of draw units does not change- not likely).


View attachment 718505


View attachment 718511
View attachment 718512
I hope your predictions are right!
 

tboltz34

FNG
Joined
Nov 18, 2020
Messages
34
Location
Minnesota
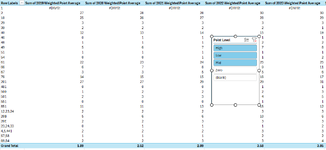
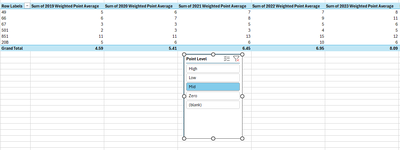
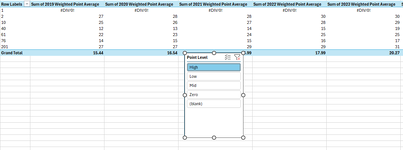
I crunched some more numbers on point creep. I only included archery units/tags because I didn't feel like spending an eternity compiling data.

What I'm trying to find is the average number of points needed to draw. This is a weighted average because I factored in the number of tags given for each unit.

I classified the level of the unit based on how many points it took to draw in 2023.
0 Points: Zero
1-4 Points: Low
5-14 Points: Mid
15+ Points: High

The chart below shows every single unit from 2019-2023. You can see the average number of points DECREASED from 2019 (needed an average of 1.67 points to draw) to 2023 (needed an average of 0.76 points to draw. This is because a large number of tags went from OTC to draw and these units have been drawing at zero points. Because this is weighted, it is skewing the data.
1717187908632.png

The next chart shows all the units EXCEPT the zero point units. I believe this is a better representation of the overall point creep for Colorado archery tags. On average, each unit is creeping 0.49 points per year.
1717188179006.png

This chart shows only low units that required 1-4 points to draw in 2023. On average, these units are creeping 0.39 points per year.
1717188348373.png

This chart shows only the mid units that required 5-14 points to draw in 2023. On average, these units are creeping 0.875 points per year.
1717188458973.png

The last chart shows only the high units that required 15+ points to draw in 2023. On average, these units are creeping 1.2075 points per year.
1717188579164.png

I'll let you all draw your own conclusion.

I'd love to add 2024 data to this because then we can see how to R/NR allocation change has shifted the data. Additionally, I love to add data before 2019 so we can understand what point creep was like before COVID. However, I already spent too much time compiling data. Maybe some day I'll add more!
 

billoo349

Lil-Rokslider
Joined
May 26, 2020
Messages
199
Alright which hunt planning website blew up my spot? The number of nr applicants doubled from last year (but less tags went to nr this year so it creeped from 3 to 6 points). And it went from a low percentage chance to draw with 2 points to a 34% chance with 3 points for a resident. And that is with more tags available this year.

Sent from my Pixel 8 Pro using Tapatalk
 
Joined
May 28, 2013
Messages
1,683
Location
Littleton, CO
Alright which hunt planning website blew up my spot? The number of nr applicants doubled from last year (but less tags went to nr this year so it creeped from 3 to 6 points). And it went from a low percentage chance to draw with 2 points to a 34% chance with 3 points for a resident. And that is with more tags available this year.

Sent from my Pixel 8 Pro using Tapatalk
Wolves
 

cnelk

WKR
Joined
Mar 1, 2012
Messages
7,747
Location
Colorado
Want to see some crazy numbers?

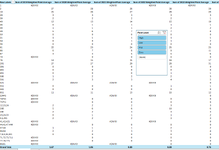
Scroll to the bottom of the Elk Recap page and look at the applicants for Preference Points only.

2 Residents have 38 PPs!
 
Joined
May 28, 2013
Messages
1,683
Location
Littleton, CO
Want to see some crazy numbers?

Scroll to the bottom of the Elk Recap page and look at the applicants for Preference Points only.

2 Residents have 38 PPs!
You can see it on the very first page as well. Then look at the successful column and they didn't draw so must have applied for points
 
Top