go_deep
dWKR
- Joined
- Jan 7, 2021
- Messages
- 3,065
Guess I can honestly say, I can't believe a correction hasn't happened sooner.
I'm sitting on some cash, and ready to buy something cheap!
I'm sitting on some cash, and ready to buy something cheap!
Follow along with the video below to see how to install our site as a web app on your home screen.
Note: This feature may not be available in some browsers.
Guess I can honestly say, I can't believe a correction hasn't happened sooner.
I'm sitting on some cash, and ready to buy something cheap!
Ironic that you mention land, that's what I am keeping my eyes on. Honestly there's already getting to be some deals on vacant land, but I'll be patient and wait it out at least till winter of 25 based on the trends I'm seeingYou’ll get it, dirt cheap. 2026-27 unless things are accelerated. Buy land/appreciating assets.
Sent from my iPhone using Tapatalk
Ironic that you mention land, that's what I am keeping my eyes on. Honestly there's already getting to be some deals on vacant land, but I'll be patient and wait it out at least till winter of 25 based on the trends I'm seeing
There's 155 acres of high-quality farm land for sale just north of me. Asking price is $13,750/ac. I'd farm it on 50/50 shares with you. It has a waterway running though it that most likely holds pheasants. You need more info? LolI don’t think it’s as bad as your making it out to be. But it is hard to believe there has not been a significant correction yet. I’ve had cash on the side waiting to buy land since the beginning of the year and still haven’t found the right piece. Just wasn’t brave enough to let it stay in the market while looking.
Microstrategy mstrCan someone just tell me what to invest in so I can go sheep hunt next year…… really tho I’m only in this for tags!!
Sent from my iPhone using Tapatalk
Can someone just tell me what to invest in so I can go sheep hunt next year…… really tho I’m only in this for tags!!
Sent from my iPhone using Tapatalk
I don’t think it’s as bad as your making it out to be. But it is hard to believe there has not been a significant correction yet. I’ve had cash on the side waiting to buy land since the beginning of the year and still haven’t found the right piece. Just wasn’t brave enough to let it stay in the market while looking.
Start with 1 kilo pure Colombian gold, cut with baking soda 50% and divide it into 8 balls..
Repeat until you have enough or are in jail.
Sent from my iPhone using Tapatalk
Glad prices aren’t that high here. Just looking for a hunting camp in coos county NH out in the woods. Glad I’m a lot of years away from retirement with the current instability.There's 155 acres of high-quality farm land for sale just north of me. Asking price is $13,750/ac. I'd farm it on 50/50 shares with you. It has a waterway running though it that most likely holds pheasants. You need more info? Lol
Start with 1 kilo pure Colombian gold, cut with baking soda 50% and divide it into 8 balls..
Repeat until you have enough or are in jail.
Sent from my iPhone using Tapatalk
Sell puts on the things you want at the price you want to pay and just let them get exercised if that's your plan. Zero reason to "buy" the dip. People should be entering most long term shares by selling puts and getting the shares put to them.Guess I can honestly say, I can't believe a correction hasn't happened sooner.
I'm sitting on some cash, and ready to buy something cheap!
Sell puts on the things you want at the price you want to pay and just let them get exercised if that's your plan. Zero reason to "buy" the dip. People should be entering most long term shares by selling puts and getting the shares put to them.
A good product will sell itself, it’s a long game vs short game. Build your client base, then the profits will come.“That’s a bold move Cotton”
You should probably have a little higher cut rate, better returns.
Sent from my iPhone using Tapatalk
Gotcha. Didn't see that.That's not at all what my comment was referencing at all. 2 posts later I specifically started I was looking for land.
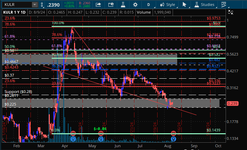
Anybody bite on that @ .22ish?If it drops below support @ .28 I'd be looking at the next support level of .22. Theres a potential gap to fill between .26-.22
View attachment 740732

