Navigation
Install the app
How to install the app on iOS
Follow along with the video below to see how to install our site as a web app on your home screen.
Note: This feature may not be available in some browsers.
More options
Style variation
You are using an out of date browser. It may not display this or other websites correctly.
You should upgrade or use an alternative browser.
You should upgrade or use an alternative browser.
The Rokslide Stock Traders Thread
- Thread starter Kilboars
- Start date
Doc Holliday
WKR
- Joined
- Jun 15, 2016
- Messages
- 3,091
Picked up some VBIV, MGEN, AUPH, ET, PE
Broomd
WKR
Good question, I'll give that a shot based on some DD, but don't quote me....Why the uptick on CDEV? Anyone know?
Sent from my iPhone using Tapatalk
Apparently Riverstone is a conglomerate of Centennial insiders that just purchased huge share portions around .90 which really rallied the stock. Methinks they know something that we don't and perhaps they see the pennies in the rear view mirror. Hey, a guy can hope!
It's a real trip seeing one stock clicking up 12-15% for the day when others are getting that asses kicked. But we holders have seen the inverse of that too with this one.
Fingers crossed that we can head into the weekend over a buck.
Hoping that some of the smaller shales like FET, GTE, CPE can float without R/S. I have $1200 or so in each.
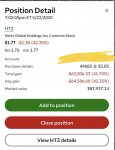
These aren't my personal buy-ins, I lifted this overview...but today's sheet:

Last edited:
bridgerbenson
WKR
Lost a little bit gambling on LK again today but made up for it 10x with CDEV. 
Sent from my iPhone using Tapatalk

Sent from my iPhone using Tapatalk
EastMT
WKR
I hope no one was holding Hertz. Dropped 40% after hours on bankruptcy news.
Ewwwwww. Yeah I’m staying away from anything travel related. There looks to be some good deals but I don’t know how it will all wash out
TreeWalking
Lil-Rokslider
- Joined
- Sep 22, 2014
- Messages
- 285
Yes, you can set a stop loss and sell order, it’s recommended 100% of the time.
Correct me if I am wrong as things can change over time but if the market opens below the stop loss then is not executed and stock price can continue to fall while you still have ownership. So, some risk remains even with stop loss paired with a sell order.
BeaverHunter
WKR
- Joined
- Sep 15, 2018
- Messages
- 1,012
Anyone that was holding Hertz at this point deserved to lose a lot of money. The news about bankruptcy being imminent was out there for weeks.
EastMT
WKR
Correct me if I am wrong as things can change over time but if the market opens below the stop loss then is not executed and stock price can continue to fall while you still have ownership. So, some risk remains even with stop loss paired with a sell order.
Depending on your platform you can set it as a market sell once is crosses a certain point and it will get you the best available price at that point or a limit sell that only sells at a certain set price.
EastMT
WKR
brettdunn7
WKR
- Joined
- Sep 8, 2019
- Messages
- 369
This dude here just added 30,000 shares at $1.30. So he’s made back $15k at this point. He’s sporting some baseballs......
And they just filed for bankruptcy.
Sent from my iPhone using Tapatalk
BrokenArrow
WKR
Luckily. I bought them at 2.95 and sold early Monday for 3.14. That was a close one.And they just filed for bankruptcy.
Sent from my iPhone using Tapatalk
go out and enjoy your day off on Monday!
I think this sideways trading trend is gonna break up or down very soon. Be rested and ready!
Trevor73402
WKR
I trade the Forex market and all I see is more fall of oil prices, it looks to like the price of oil is going back up, don't be deceived or played, oil is doomed at the moment.
Please share with us all how you came to this conclusion/prediction? I like a few facts thrown into my bowl of shit soup.
Trevor73402
WKR
Thanks for the reply. Although I don't know anything about your Fibonacci chart lines, I can tell you that once normal travel resumes for the majority of America, jets are back in the sky, and cruise ships are making waves again. the price of oil will slowly return to $50+ a barrel. I see this happening by Sept-Oct time frame. There is no reason for oil to be anymore bearish than before once the usage returns to normal (and its already on its way). Once we quickly burn through the storage we have built up due to the recent decrease in demand, I could see it going way above $60/bbl for a time until production resumes and catches up to demand. I predict summer time travel (road travel) will be higher this year than previous years. People have been stuck at home way too long and the desire to get out and travel will be high. With most of America either getting increased unemployment benefits, or still working, the financial aspect of it won't play as much of a factor.Thank you for asking. As we all know it investing involves risk and prediction is based on personal bias and what the tape in the market is saying. I have a special way I read the chart and interpret what the market is saying exactly.
The current OIL PRICE on my chart is at $33.37. Using the Fibonacci level, Price is currently at a key chart level $33.37, using Fibonacci retrace, other Resistance key chart levels on my chart are $38.17 and $43.21. At level $43.21 there is a 'window' or 'gap' to the left, that is, this a price action that is very significant, (Price action traders would understand this price signal better). I believe (FROM MY MARKET GUT FEEL) price wants to rally and close the 'window' before it resumes its initial bearish move. The long term trend for the OIL MARKET is BEARISH. Do not buy oil according to my personal opinion from what I have logically interpreted from my charts.
I HOPE I HAVE MADE SOME SENSE AND IF YOU HAVE ANY MORE QUESTIONS, KINDLY ASK. CHEERS!
Yours sincerely,
Paul.
Dont invest in oil based on anything Im saying......
Broomd
WKR
I gotta say, if I 'kept my powder dry" over the last two months I'd be $30,000 poorer right now. And I know of others here than have made much, much more than that.Is it safe to buy things now?
This market is a traders dream.
If a guy has an ounce of common sense, patience and disposal income, the sky is the limit.
Once-in-a-lifetime opportunities out there!
Broomd
WKR
Interesting dialogue from all on oil and appreciated.Thanks for the reply. Although I don't know anything about your Fibonacci chart lines, I can tell you that once normal travel resumes for the majority of America, jets are back in the sky, and cruise ships are making waves again. the price of oil will slowly return to $50+ a barrel. I see this happening by Sept-Oct time frame. There is no reason for oil to be anymore bearish than before once the usage returns to normal (and its already on its way). Once we quickly burn through the storage we have built up due to the recent decrease in demand, I could see it going way above $60/bbl for a time until production resumes and catches up to demand. I predict summer time travel (road travel) will be higher this year than previous years. People have been stuck at home way too long and the desire to get out and travel will be high. With most of America either getting increased unemployment benefits, or still working, the financial aspect of it won't play as much of a factor.
Dont invest in oil based on anything Im saying......
I also think that in spite of the media's endless doom and gloom, people are itching to get out, travel, use oil.
One could make the argument that once some of these smaller caps are weeded out that others who were better prepared to weather this event will flourish to higher levels and stock value, proportionate to the overall market sector.
Just a thought.
Okay so trying to understand how this works. In a market where doubling your money is super easy. I thought I would check these recommendations from March 4 compared to yesterday. For my exercise, I'll buy 1 share of each on March 4th and sell yesterday.
Baba March 4th $211.96 May 20 $216.82
BIDU March 4th $121.41 May 20 $108.52
PXD March 4th $123.50 May 20 $92.43
GPP March 4th $13.96 May 20 $6.12
BPMC March 4th $60.46 May 20 $63.49
TDOC March 4th $124.64 May 20 $171.27
total March 4th $655.93 Total May 30 $658.65
Total return .004%
Not sure how a person can make a great gain on those, I guess by intraday trading and getting lucky. I'll stick with my 11% per year and 12% per year return each of the last 10 years including this drop in my index funds. People day trade and make money all the time. Me, I'll keep my head in the sand thanks.
Based on y
bought SM on low today .Bland market today...set the limits, go enjoy life.
Thanks for the reply. Although I don't know anything about your Fibonacci chart lines, I can tell you that once normal travel resumes for the majority of America, jets are back in the sky, and cruise ships are making waves again. the price of oil will slowly return to $50+ a barrel. I see this happening by Sept-Oct time frame. There is no reason for oil to be anymore bearish than before once the usage returns to normal (and its already on its way). Once we quickly burn through the storage we have built up due to the recent decrease in demand, I could see it going way above $60/bbl for a time until production resumes and catches up to demand. I predict summer time travel (road travel) will be higher this year than previous years. People have been stuck at home way too long and the desire to get out and travel will be high. With most of America either getting increased unemployment benefits, or still working, the financial aspect of it won't play as much of a factor.
Dont invest in oil based on anything Im saying......
Not to mention another skirmish in the mideast. I just made almost 5k on SM and REI last week in 4 days and then flipped them.
DenverCountryBoy
WKR
- Joined
- Jun 17, 2017
- Messages
- 1,272
I'm not a FOREX trader, but I can tell you that his technicals analysis does not take into account the initial cause of the oil bear market, the Russian - Saudi price war. Then the 'rona came along and punched demand in dick and the Russians and Saudis decided to play nice for now.Who else is a forex trader/investor here and can validate what @paulrok has said?
With the cause of the bear market resolved (for now) and demand slowly returning, price/barrel should slowly rise. If there is a second wave of Covid this winter, oil price could slide on decreased demand, but if a vaccine comes out before the second wave hits, oil could jump.
HuntHarder
WKR
SUCKS!! I am working in the middle of nowhere with little to no reception. I had to change my investments to longer term and hope they do good. I was really having a good time "semi day trading" and I made some great money.
Trevor73402
WKR
I'm not a FOREX trader, but I can tell you that his technicals analysis does not take into account the initial cause of the oil bear market, the Russian - Saudi price war. Then the 'rona came along and punched demand in dick and the Russians and Saudis decided to play nice for now.
With the cause of the bear market resolved (for now) and demand slowly returning, price/barrel should slowly rise. If there is a second wave of Covid this winter, oil price could slide on decreased demand, but if a vaccine comes out before the second wave hits, oil could jump.
I don't see a second wave really impacting too much because the American people won't go for another lock down. It will fall on deaf ears and there is no way to enforce it when entire state populations refuse to abide. By the time winter comes, most of the fear surrounding the virus will have faded (for most people). Once we get 3-4 weeks of summer travel behind us, production will start to ramp back up, along with the price.
Similar threads
- Replies
- 7
- Views
- 527
- Replies
- 90
- Views
- 7K

Featured Video
Latest Articles
- How to Kill Giant Bulls with Ryan Carter
- Kifaru Enters the Hunting Apparel Space: Review
- From Big Bucks to Bear Hunts: Catching Up with Jordan Budd
- Mule Deer Days Wildlife Conservation Mashup
- A Hidden Gem: Hunting Washington with Kari Thomas
- Prime Divide Bow Review
- Knowledge From Storms: Surviving and Thriving in the Backcountry with John Barklow
- DIY Wyoming Pronghorn Hunt
- Unlock Precision Shooting: Master Your Hunting Game with Competitive Insights
- Topo Topper Rincon Review