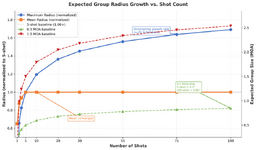
I know that for a 15 shot group the .68 inch group will get larger most likely. But wouldn’t the 1.47 inch group as well?
They'll both get larger (most likely) but because your sample size is so small there's a lot of variability in the group size. What you'll probably see is the 0.68 group will get a lot larger and the 1.47 group grow a lot less. If you were to put down 20-30 shots for each load they'll probably end up pretty close to the same.
Here's one way to look at it. A 30 shot group is pretty good approximation of the max dispersion of the system (the cone of fire). Within that 30 shot group there's 4,060 unique 3 shot combinations. Shoot 30 some time and then look at it for a minute. There's super small little bug holes. There's big ugly looking triangles. There's vertical stringing, horizontal stringing, two in one out, double grouping, in other words, whatever group shape and size (within the cone of fire) you can think of is displayed in those 4,060 combinations.
So here's the question. When you say one group is 0.68 and the other 1.47, which two of those 4,060 combinations are you looking at?