Navigation
Install the app
How to install the app on iOS
Follow along with the video below to see how to install our site as a web app on your home screen.
Note: This feature may not be available in some browsers.
More options
Style variation
You are using an out of date browser. It may not display this or other websites correctly.
You should upgrade or use an alternative browser.
You should upgrade or use an alternative browser.
New Mexico Big Game Draw Simulator
- Thread starter Bigeaux20
- Start date
wapitibob
WKR
So this database (of which this is a snippet), that is a public document? They use this one? Or a different one? This is what I used.
That is a draw report spreadsheet, not the NM Elk draw database. You need to file a public info request to get the database.
To accurately simulate the NM draw specifically, you need to know the choices, by order, of every applicant, and use the same random number generator, under the same parameters the NMDGF.
As I said before, Gohunt buys the database; which has all choices, in order, for every applicant. Then they run a monte carlo simulation. You may not like the results, but they're not "wrong". The difference is NM (likely) assigns random numbers differently than Gohunt does, and only runs thru the database one time.
This is an example of the WY draw database.

Maverick1
WKR
- Joined
- Jun 1, 2013
- Messages
- 2,896
Not certain what you are asking in terms of “what do the odds mean”???."Mental Masturbation" is a great line. I'm not sure you haven't nailed it. Feels like a question I am driven to answer more than the joy at the end. Tell me if this is the wrong way to look at it, but the question I keep asking and tell me if you have a feel for the answer, but what do the odds mean. The question I am trying to answer is not what do the odds mean in general terms, but what does it specifically mean. Does it mean if there is 3% odds I can expect to draw 3 times in 100 draws? Does it mean if there are 100 people, 3 should expect to draw. Does that make sense?
But to put it into terms for understanding and provide some perspective: If you applied for a tag every year from the age of 20 to the age of 70, over that 50 year period the odds would indicate you might draw one tag. Or zero tags. Or two tags.
On any individual year: you and 49 of your best friends apply for tags. Out of you and those 49 friends, one of the fifty of you would get a tag. Or two.
As stated above, creating a tool to get to that answer is kind of an exercise in mental masturbation.
Start key-stroking. Knock yourself out!
Maverick1
WKR
- Joined
- Jun 1, 2013
- Messages
- 2,896
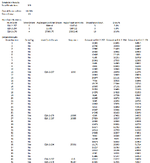
I pulled some random hunt codes for non-residents and ran it 100 times. Like I said if anyone else wants to see the simulation on three hunt codes, post em up and I will put up the report. I already know im crazy, but maybe this can help someone.
Mental masturbation:

wapitibob
WKR
......
As stated above, creating a tool to get to that answer is kind of an exercise in mental masturbation.
Start key-stroking. Knock yourself out!
And all these "odds" are past tense; created after said drawing is complete. No different than looking at the odds of winning 5 games of solitaire, after you finished playing.
Predictive odds is where were headed.
Well I guess we will see how obtainable it really is. See you didn't even know you were helping all along. Nice job. I appreciate you!Not certain what you are asking in terms of “what do the odds mean”???.
But to put it into terms for understanding and provide some perspective: If you applied for a tag every year from the age of 20 to the age of 70, over that 50 year period the odds would indicate you might draw one tag. Or zero tags. Or two tags.
On any individual year: you and 49 of your best friends apply for tags. Out of you and those 49 friends, one of the fifty of you would get a tag. Or two.
As stated above, creating a tool to get to that answer is kind of an exercise in mental masturbation.
Start key-stroking. Knock yourself out!
swavescatter
Pain in the butt!
- Joined
- Apr 3, 2021
- Messages
- 1,962
I finally got access to draw odds with free onyx premium... Meh.
I've written Monte Carlo simulations before, but with things much more straightforward: nuclear physics. People aren't predictable like physics.
Unless you're modeling sentiment based on previous year weather for each unit, but also changes in neighboring states (based on species) and predictive draw pool population, you're likely missing half of the story.
In the end, I pick two dream tags for choices 1 & 2, followed by a slump buster third choice. Either I pull a low draw ranking or I don't. For non residents, I doubt it matters as much.
The "people aren't predictable like physics" is saying a lot. Seems like that's about all anyone can extrapolate is some variance based on how they acted this time, then that time, and the last time, etc... It seems like it's a known unknown in that it's impossible to predict what people will do. But what feels like is possible, is to draw comparisons from what they have done overtime and those patterns seem to converge. And it seems to me the dynamics of a single draw, is dependent on the random sequencing. Human choice could literally change 25% in one direction, and the draw will produce 25% in the other. Hyperbole of course. It's been an interesting endeavor for certain.I finally got access to draw odds with free onyx premium... Meh.
I've written Monte Carlo simulations before, but with things much more straightforward: nuclear physics. People aren't predictable like physics.
Unless you're modeling sentiment based on previous year weather for each unit, but also changes in neighboring states (based on species) and predictive draw pool population, you're likely missing half of the story.
In the end, I pick two dream tags for choices 1 & 2, followed by a slump buster third choice. Either I pull a low draw ranking or I don't. For non residents, I doubt it matters as much.
With OnX premium or elite you should be able to get Huntin Fool odds as well, in case you weren't aware. And why are they so much different than GoHunt? That's what got me going down this rabbit hole in the first place. Interesting perspective for certain.
Mighty Mouse
WKR
In common parlance, I would say 3% odds means the latter (i.e., 3 out of 100 applicants drew). That’s certainly how New Mexico (and all other states to my knowledge) reports their data: they tell you there were X number of applicants and Y number of them drew. Knowing the odds of success in a single year, you can calculate the odds of drawing any number of times over any number of years using the binomial distribution formula:The question I am trying to answer is not what do the odds mean in general terms, but what does it specifically mean. Does it mean if there is 3% odds I can expect to draw 3 times in 100 draws? Does it mean if there are 100 people, 3 should expect to draw. Does that make sense?

Below is a graph of this formula for every value of x with n=100 and p=3%. There is no single answer to “How many times can I expect to draw?” The answer is a distribution of probabilities.

Yeah now the trick is getting that to translate to a cohort of people who lack the chops to absorb all that. I can follow along, but I can't explain it back to you. Tell me if this sounds bananas. To me it's easier to digest that if you want one of the 9 late archery non-resident tags in 16A, you have to be sequenced, on average, in the top 2000 people when the music stops. If you change to the early archery instead, once again on average, you have to be in the top 6000. And that is an extrapolation of thousands of simulations that eventually converge to something that resembles a value. And as always, I think this is true. How do you feel about that information. Thanks a ton for your input. It's awesome and the math aspects take me way back to when my brain was younger.In common parlance, I would say 3% odds means the latter (i.e., 3 out of 100 applicants drew). That’s certainly how New Mexico (and all other states to my knowledge) reports their data: they tell you there were X number of applicants and Y number of them drew. Knowing the odds of success in a single year, you can calculate the odds of drawing any number of times over any number of years using the binomial distribution formula:
View attachment 852642
Below is a graph of this formula for every value of x with n=100 and p=3%. There is no single answer to “How many times can I expect to draw?” The answer is a distribution of probabilities.
View attachment 852643
Mighty Mouse, this is going to sound like weak sauce, but by all means I don't have the skillset to differentiate your binomial distribution against the simulation approach. I had to ask AI what the differences were. When I started this, the question was, what is the absolute most dependable and accurate as possible approach to determining the likelihood of being drawn. Don't quote that but it was some mumbo jumbo like that. A Monte Carlo simulation was the answer provided. What came after that was just an exercise where I kept asking what if. Just wondering how this lands with you?
Binomial Distribution Approach:
Strengths:
Simple and analytical: Easy to compute exact probabilities without running simulations.
Provides a clear theoretical distribution of outcomes over many trials.
Useful for understanding long-term odds with a fixed success rate.
Weaknesses:
Oversimplified: Ignores real-world complexities like multiple choices, quotas, and competition.
Assumes a constant success rate, which may not reflect reality (e.g., the simulation showed ELK-2-257 had a 5% draw rate, not 3%).
Less practical for short-term planning (e.g., “Will I draw in 2025?”).
Simulation-Based Approach:
Strengths:
Realistic: Models the actual draw process, including choice preferences, quotas, and competition.
Detailed: Provides per-hunt-code, per-category, and per-choice success rates, plus additional metrics like exhaustion points and “Bigeaux” success rates.
Practical: Focuses on a single year (2025) with projected data, making it directly applicable to planning.
Flexible: Can incorporate historical data, variability, and custom rules (e.g., the “Bigeaux” applicant strategy).
Weaknesses:
Computationally intensive: Requires running many simulations (100 in your code) to get stable results.
Relies on assumptions: The ±X% variation in applicant numbers and the rules for assigning 2nd/3rd choices are based on assumptions that may not perfectly match reality.
Single-year focus: Doesn’t directly address long-term odds over 100 years (though you could extend the simulation to multiple years).
Elkoholic87
WKR
Jesus, just apply and see what happens.
NM_Hunter1
FNG
- Joined
- Mar 14, 2025
- Messages
- 3
I wrote some software that runs a batch of NM draw simulations until the odds have converged. I'd be happy to benchmark your results against mine. I've been using mine for a few years with a big group of folks applying and have been pretty much right on the money as far as expected outcomes across a bunch of applications.Alright, let’s slow this down for a minute and talk about something that’s been rattling around in my head. Picture this: I’m just a flatlander, born and raised east of the Mississippi. Where I come from, the ground’s not just flat—it’s soft, forgiving. Nothing like the rugged terrain you folks out west deal with. Now, I’ve been trying to wrap my head around this big game draw system—trying to crack the code, you know? And me, being a little bit of a numbers guy—okay, maybe a numbers nerd if I’m being honest—I started wondering: what if there’s a better way to get a feel for this?
They say experience is the best teacher, right? But who’s got the time—or the tags—to rack up decades of draw experience? So I thought, why not create a way to fast-track that? I'm not a program writer or coder or whatever you call it. I'm just a guy who spends too much time obsessing about this stuff. What if I could run a simulation—multiple draws, over and over—until the patterns start showing themselves and somehow make sense of what these "draw odds" really mean? That’s where this idea came from. My approach was if I made these three selections, and simulated the draw, how many times would I win. Here's something I didn't expect. If the odds are 4%, the simulation results weren't 4 times out of 100. It's astonishing.
I took past draw data—real numbers, real outcomes—and built something that creates a random pool of applicants, just like the real thing and with the same strategies and tendencies. Then it adds your choices into the mix and runs the draw as many times as you want. One simulation? Sure. Ten? Why not. A hundred? A thousand? Now we’re talking.
And here’s the kicker—it’s built to mimic how the New Mexico Big Game draw actually works. Random sequence, choice-based, the whole deal. And you can run it for any animal in the draw, any hunt code, any weapon, and any category of resident, non-resident, or outfitter. In the end it's spits out a spreadsheet that gives some interesting information. I’ve got some examples here, some screenshots to show you what it looks like in action. I did all this as a personal tool, but I’m even kicking around the idea of putting this online, maybe a website where anyone can use it. But here’s where I need you—I’m not too proud to ask for help. What do you think? Is this something that’d be useful to you? Something worth digging into deeper? I’m all ears—lay it on me. Is there something here? Pick it apart. What makes you interested or skeptical?
For me to run the simulation you need to make specific hunt code choices and see how they play out. You can message the choices to me, and give me an email and I will send you the spreadsheet.I drew a muzzleloader ibex tag last year
I put rifle as my first choice and muzzy second. No 3rd choice. Non resident.
Run that and see what it looks like?
CarterHunt
Lil-Rokslider
- Joined
- Aug 10, 2023
- Messages
- 133
This is a huge part of my draw strategy. I lay out the odds for hunts I am interested into a spreadsheet and try to get to a "cumulative" draw odds number that I am happy with (after also also considering deadline/results posting dates, cost, etc.)My instinct tells me that this would be the way to quickly estimate overall odds of success in New Mexico:
P_overall = 1 – (1 – P_1) • (1 – P_2) • (1 – P_3)
where P_1, P_2, P_3 are your odds of success (based on the draw report) for choices 1, 2, 3 respectively.
Example: If my 3 choices have individual draw odds of 3% (e.g., 100 applicants last year for that tag with 3 successful), 4%, and 5%, my overall odds of drawing 1 of the 3 would be 1 – (1 – .03) • (1 – .04) • (1 – .05) = 11.5%
This method works to compute overall odds of a single result over a series of independent events of known individual probabilities (e.g., repeatedly rolling dice). The New Mexico draw is a bit more complicated than rolling dice, but my gut says this method would get you close. How does this method compare to your simulation?
I do go back and forth on New Mexico though because of the draw mechanics. Since I am only getting one "number" and they consider all choices for the next, I typically just look at my NM species odds as a single event (as the choice with the highest draw odds) rather than my odds of being drawn for this hunt. The way I see it, if I don't have a good enough "number" to draw my third choice, then the odds of drawing my first choice are practically zero.
deltadukman
WKR
- Joined
- Sep 16, 2021
- Messages
- 388
For me to run the simulation you need to make specific hunt code choices and see how they play out. You can message the choices to me, and give me an email and I will send you the spreadsheet.
There is the million-dollar idea. "let me see what you're putting in for and I'll run you a simulation". Nope, no way, no how. I wanted to read the whole thread before this came up and it surprising took longer than anticipated. No way am I telling a 3rd party what and where I am putting in for. Sorry Jim Cramer.
CMF
WKR
I'll play. This strategy was very specific, and not for me specifically. We already drew an AZ late rifle, so I chose codes on either side of our AZ hunt, so in the rare chance we draw, we'll make it all in one trip.Seriously, anyone suggest your hunt codes, and it can be for any animal, any weapon, and resident, non-resident, or outfitter.
ELK-3-310, ELK-3-261, ELK-3-201
Can you elaborate on what you think can be done with 3 provided hunt codes that may or may not be true and the application period has already ended?There is the million-dollar idea. "let me see what you're putting in for and I'll run you a simulation". Nope, no way, no how. I wanted to read the whole thread before this came up and it surprising took longer than anticipated. No way am I telling a 3rd party what and where I am putting in for. Sorry Jim Cramer.
deltadukman
WKR
- Joined
- Sep 16, 2021
- Messages
- 388
If you're a newbie to NM, you can take a hunt code, Say Elk-1-123(hypothetical like ABC-123) from a guy who you perceive is pretty knowledgeable about elk units and not putting in for one of the historical top tier units, and find out sleeper units. Hunt codes may change from time to time, but you can reference the current year and say "Albert puts in for Unit 1-A second rifle, and he seems successful". I may try that next year. Basically, can have a starting point based upon inquiries for units that may otherwise not be popular.Can you elaborate on what you think can be done with 3 provided hunt codes that may or may not be true and the application period has already ended?
Plus, he's from Louisianna. You ever hunt next to coonasses?
butcherboy
WKR
My brain exploded after reading this thread!  I just put in for what I would like to hunt and don’t worry about the rest. I have drawn OIL tags as a second choice before and premium tags as a 3rd choice.
I just put in for what I would like to hunt and don’t worry about the rest. I have drawn OIL tags as a second choice before and premium tags as a 3rd choice.Similar threads

Featured Video
Latest Articles
- Sitka Dewpoint UL jacket Review
- John Radzwilla’s Secret to Communicating Hunting’s Value to Non-Hunters
- Hawkins Precision Updraft Muzzle Brake Review
- The Fundamentals of Scouting For Mule Deer & Elk | Hunt West Crossover
- Wiser Precision BA-7 Sparrow Binocular Adapter Review
- How to Kill Giant Bulls with Ryan Carter
- Kifaru Enters the Hunting Apparel Space: Review
- From Big Bucks to Bear Hunts: Catching Up with Jordan Budd
- Mule Deer Days Wildlife Conservation Mashup
- A Hidden Gem: Hunting Washington with Kari Thomas