Cold bore zero versus (very) Hot bore zero “test”

I am not sure if this has been asked before but for hunting purposes , would multiple 3 shot cold bore groups be more useful for establishing a zero vs one large hot bore group?

Ehh. It doesn’t really matter that much. Just get 20’ish shots on a single aiming point and go from there.

The best thing for most would be to break and build the position for each shot, for those twenty rounds. The group will be larger, but will center you true cone.
 
As promised, here is a follow-up take on the initial cold/hot-bore test that kicked this thread off.

I've already demonstrated that I'm a mediocre shooter who's still learning ballistics. But I am a data nerd, and I was confused by some of the patterns I saw in those test results.

TL;DR: Looking back now, I see that only a few exhibited clear horizontal/vertical bias. The core of my confusion at this point relates to how the size of groupings (either no-flyers-allowed MOA, or the more forgiving mean radius) change between cold and hot bore for these rifles, and how POI shifts take place between the two as well.

I'll paste the targets and captions that I was curious about, along with some musings in italics below them, in hopes that it stimulates additional learning for all of us.


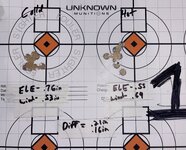
“Gun #1 no shift cold to hot.” “Well inside statistical variation.”
IMG_2523.jpeg
These look different to my eye. The cold bore group is nearly inside of one grid (half an inch?). The other is pushing out to nearly three grids. What measure of statistical variation is being used here as a guide?


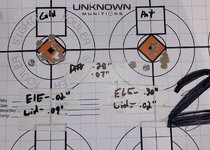
“Gun #2 no shift cold to hot:” “Well inside statistical variation.”
IMG_2524.jpeg

These look different to my eye also. The cold bore group is destroying the bullseye. The hot bore group, though certainly within minute of deer, looks to be opening up significantly and the mean POI drifting south.


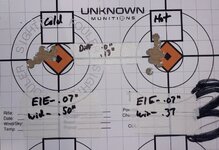
“Gun #3 no shift cold to hot:” “Well inside statistical variation.”
IMG_2525.jpeg


I guess this is the one that seemed so strikingly different in terms of the way in which the “error” or POI is distributed. Same MOA, by the looks of it. But shots are walking horizontally when fired from a cold bore and vertically when hot.


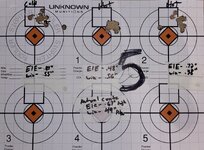
“Gun #5 no shift cold to hot.” “The rifle just doesn’t particularly like the ammo.”
IMG_2527.jpeg

I was puzzled by the post-hoc reasoning here. It’s not obvious to my eye that this rifle doesn’t like the ammunition. With the exception of one outlier in the first cold-bore test and another in the second hot one, it looks like a mighty fine rifle/ammo combo to me. Especially the second hot-bore grouping. While this rifle clearly experiences a shift in POI right and downward when fired from a hot barrel, the overall performance here sure does cast doubt on the cold bore theory--at least for this rifle.

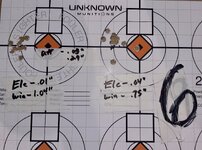
"Gun #6 no shift cold to hot:” “Well inside statistical variation.”
IMG_2528.jpeg

At first glance I would tend to agree with this assessment. The POI doesn’t appear to shift all that much between a cold and hot barrel. But in a world where the word “flyer” isn’t allowed, the hot barrel very obviously is producing a degraded level of accuracy out of the hot barrel with those two shots that went astray. Again, I find myself wondering what statistical measure is being used to determine whether this was ‘inside statistical variation’?


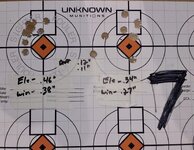
“Gun #7 no shift cold to hot:” “The rifle does not shoot this ammo well.”
IMG_2529.jpeg

Again, very different groupings and mean POIs, as well as more post-hoc reasoning. How could we reasonably know it was the ammo and not the hot bore producing the less-impressive hot-bore results?


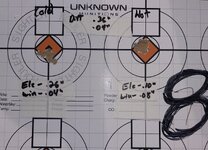
“Gun #8 no shift cold to hot:”
IMG_2530.jpeg

No qualms here. Just a desperate plea for Form to sell me this rifle.

Garbage barrels are garbage barrels. Barrels that walk, shift or move based on temperature are garbage.

True by definition. But a fundamentally different claim than one that bore temps don’t matter. If the central argument here is that bore temperature affects all rifles differently, I could more easily understand these results. My (amateur) read is that:
  • Some rifles exhibit a small but non-trivial POI shift as the barrels heat up.
  • Some rifles exhibit a larger mean radius when barrels heat up.
  • Some rifles exhibit both.
  • Some rifles exhibit none of the above.
  • I should've bought a Tikka.
The data scientist in me would also be willing to consider another post-hoc rationalization: Did variation in shooters or rests over the course of these tests produce some of these shifts that I observed in the original test targets? Hard to prove, and I suppose these would be expected to be relatively constant across the cold- and hot-bore shots. Unless we start talking about shooter fatigue...


Moving on to my own cold/hot-bore results, a couple of reflections:

First, thank you so damn much. To you @Formidilosus and @Macintosh , for responding to my humble test and taking the time to plot my mediocre shooting out and help me think through how to zero my rifle based on these data. And to @NSI for sending me an incredibly thoughtful message about how I might begin to improve upon my field marksmanship. Rokslide has been an invaluable resource for me over the last two years as I sought to turn my childhood dream of going hunting into a healthy outlet for my mid-life crisis. But this kind of support? Really gents, I’m deeply grateful.

Overall I found the overlays insanely helpful. Indeed, I adjusted my rifle zeroing based on them. But I did have some confusion, mainly focused around the idea that the shot-by-shot variation that we observe would be expected to assume some cone-like normal distribution as @Macintosh described above. Specifically, Form's comment,


Here’s all 30 shots overlaid. There is no “pattern” to first shots. Draw a circle around all 30 shots and if you kept shooting, that circle would fill in.

IMG_2478.jpeg


Again, correct me if I’m mistaken here, but when I look at this shot pattern I don’t see the makings of a cone that is going to be filled in. I see a vertical string of cold-bore shots with a rightward POI shift, and a horizontal string of hot bore shots that is roughly centered on the target but with an upward POI bias.

Please feel free to put a Lil-Rokslider in his place here. And thanks again, all, for an incredibly informative exchange here.
 

Attachments

  • 1729657744292.png
    1729657744292.png
    1.4 MB · Views: 12
Statistically significant is key. I've not ran the numbers, don't know how they determine statistical significance, but if differences do not meet statistical significance in any data pool (and smaller samples need larger differences), then looking for patterns in them is nothing more than the data equivalent of fun house mirrors.

10 shots is a very small sample from a statistics perspective.

Now, if somebody can take the time to crunch numbers and give us some p values.
 
As promised, here is a follow-up take on the initial cold/hot-bore test that kicked this thread off.

I've already demonstrated that I'm a mediocre shooter who's still learning ballistics. But I am a data nerd, and I was confused by some of the patterns I saw in those test results.

TL;DR: Looking back now, I see that only a few exhibited clear horizontal/vertical bias. The core of my confusion at this point relates to how the size of groupings (either no-flyers-allowed MOA, or the more forgiving mean radius) change between cold and hot bore for these rifles, and how POI shifts take place between the two as well.

I'll paste the targets and captions that I was curious about, along with some musings in italics below them, in hopes that it stimulates additional learning for all of us.


“Gun #1 no shift cold to hot.” “Well inside statistical variation.”
View attachment 780660
These look different to my eye. The cold bore group is nearly inside of one grid (half an inch?). The other is pushing out to nearly three grids. What measure of statistical variation is being used here as a guide?


“Gun #2 no shift cold to hot:” “Well inside statistical variation.”
View attachment 780661

These look different to my eye also. The cold bore group is destroying the bullseye. The hot bore group, though certainly within minute of deer, looks to be opening up significantly and the mean POI drifting south.


“Gun #3 no shift cold to hot:” “Well inside statistical variation.”
View attachment 780662


I guess this is the one that seemed so strikingly different in terms of the way in which the “error” or POI is distributed. Same MOA, by the looks of it. But shots are walking horizontally when fired from a cold bore and vertically when hot.


“Gun #5 no shift cold to hot.” “The rifle just doesn’t particularly like the ammo.”
View attachment 780663

I was puzzled by the post-hoc reasoning here. It’s not obvious to my eye that this rifle doesn’t like the ammunition. With the exception of one outlier in the first cold-bore test and another in the second hot one, it looks like a mighty fine rifle/ammo combo to me. Especially the second hot-bore grouping. While this rifle clearly experiences a shift in POI right and downward when fired from a hot barrel, the overall performance here sure does cast doubt on the cold bore theory--at least for this rifle.

"Gun #6 no shift cold to hot:” “Well inside statistical variation.”
View attachment 780664

At first glance I would tend to agree with this assessment. The POI doesn’t appear to shift all that much between a cold and hot barrel. But in a world where the word “flyer” isn’t allowed, the hot barrel very obviously is producing a degraded level of accuracy out of the hot barrel with those two shots that went astray. Again, I find myself wondering what statistical measure is being used to determine whether this was ‘inside statistical variation’?


“Gun #7 no shift cold to hot:” “The rifle does not shoot this ammo well.”
View attachment 780665

Again, very different groupings and mean POIs, as well as more post-hoc reasoning. How could we reasonably know it was the ammo and not the hot bore producing the less-impressive hot-bore results?


“Gun #8 no shift cold to hot:”
View attachment 780666

No qualms here. Just a desperate plea for Form to sell me this rifle.


True by definition. But a fundamentally different claim than one that bore temps don’t matter. If the central argument here is that bore temperature affects all rifles differently, I could more easily understand these results. My (amateur) read is that:
  • Some rifles exhibit a small but non-trivial POI shift as the barrels heat up.
  • Some rifles exhibit a larger mean radius when barrels heat up.
  • Some rifles exhibit both.
  • Some rifles exhibit none of the above.
  • I should've bought a Tikka.
The data scientist in me would also be willing to consider another post-hoc rationalization: Did variation in shooters or rests over the course of these tests produce some of these shifts that I observed in the original test targets? Hard to prove, and I suppose these would be expected to be relatively constant across the cold- and hot-bore shots. Unless we start talking about shooter fatigue..


Do understand what was being tested?


Moving on to my own cold/hot-bore results, a couple of reflections:

First, thank you so damn much. To you @Formidilosus and @Macintosh , for responding to my humble test and taking the time to plot my mediocre shooting out and help me think through how to zero my rifle based on these data. And to @NSI for sending me an incredibly thoughtful message about how I might begin to improve upon my field marksmanship. Rokslide has been an invaluable resource for me over the last two years as I sought to turn my childhood dream of going hunting into a healthy outlet for my mid-life crisis. But this kind of support? Really gents, I’m deeply grateful.

Overall I found the overlays insanely helpful. Indeed, I adjusted my rifle zeroing based on them. But I did have some confusion, mainly focused around the idea that the shot-by-shot variation that we observe would be expected to assume some cone-like normal distribution as @Macintosh described above. Specifically, Form's comment,


Again, correct me if I’m mistaken here, but when I look at this shot pattern I don’t see the makings of a cone that is going to be filled in. I see a vertical string of cold-bore shots with a rightward POI shift, and a horizontal string of hot bore shots that is roughly centered on the target but with an upward POI bias.

Please feel free to put a Lil-Rokslider in his place here. And thanks again, all, for an incredibly informative exchange here.


You’re seeing what you want to see. Sometimes shots land in a line left to right. Sometimes up and down. Sometimes diagonally. Sometimes in a clockwise circle, sometimes counter clockwise. Sometimes in a star pattern. Etc, etc.


Shoot enough and you get something that looks like this-

Horizontal stringing, right?
IMG_2551.jpeg


Until you fire more shots-
IMG_2552.jpeg


Horizontal stringing again, right?
IMG_2553.jpeg


Again, until more are fired-
IMG_2554.jpeg


Of course, group size can make it easier or harder to see the cone-
IMG_2550.jpeg


IMG_2549.jpeg


The reason that the “cone” nature is easier to see in the last two is because the cone itself is so much smaller- it takes less rounds to fill out. Had the top two combos been fired for another 50 to 100 rounds, they too would have had a very visually round cone.
 
Statistically significant is key. I've not ran the numbers, don't know how they determine statistical significance, but if differences do not meet statistical significance in any data pool (and smaller samples need larger differences), then looking for patterns in them is nothing more than the data equivalent of fun house mirrors.

10 shots is a very small sample from a statistics perspective.

Now, if somebody can take the time to crunch numbers and give us some p values.


10 shots is a small sample size. However, somewhere in this he and others either didn’t understand what was being looked at, or forgot it. It wasn’t group size.
 
Discussions around “cold bore shifts” and “cold bore zeroes” versus “warm or hot barrel zeroes” are constant. So is the belief that barrels “walk” when they heat up or that groups open when they heat up.

After having multiple discussions, @Ryan Avery and Jake @Unknown Munitions and I set up a day to shoot and measure what happens. Quite a bit of discussion happened with getting everyone on the same page, and explaining the limitations and resolution that would be able to be measured. Basically- the more data, the mare accurate the results will be. However, there is a cutoff point where more rounds are being shot without really increasing resolution in the results.

Mainly we were discussing whether 10, 20, or 30 round groups should be utilized.
For best data (95% probability) 30 shot groups are required. So that would be 30 cold bore shots, and then 30 hot bore shots from each rifle. The benefit with 30 round groups is the mean point of impact (MPOI) would be very solid- there would be very little deviation between groups and any deviation beyond about .1 inch would confidently be attributed to a real, observable shift due to heat. The issue with 30 round group sizes is time required and the amount of ammunition required for the rifle being shot.
10 rounds was the minimum required to get usable data. The time and ammo expenditure would be significantly less, but the resolution would be less as well. If a rifle averaged 1 MOA for ten round groups, the center of any group could vary by up to +/- 1/3rd MOA. That is, with nothing changing from 10 round group to 10 round group, you can and will see the apparent center shift around by up to .2-.4 MOA due to ten rounds not showing the true cone.
20 rounds would split the difference with being a bit closer to 30 round accuracy than 10 round accuracy.

Ultimately it was decided that we would use 10 round groups- one 10 round group of cold bore shots, and one 10 round group of hot bore shots as a baseline, with the understanding that there can be a shift of apparent center by up to .3 MOA or so with no change. If you shoot 10 cold bore rounds into a group, and another 10 cold bore rounds into a second group- the centers of each group will vary slightly in respect to the point of aim because 10 rounds isn’t enough to show you the true center for most rifle systems.
Due to that statistical and group reality, it was agreed that only significant and functional shifts would be noted and that was agreed to be .1 mil (.36 inches at 100 yards) or one click of the scope. Again due to limitations of ten round groups, any rifle that showed a shift of more than .36 inches from cold to hot would have another ten rounds fired to see if it was consistent.

This process would be done with ten (10) different rifles. A starting temperature was measured inside the chamber and at the end of the barrel for each rifle before starting. The rifles would be shot one round at a time round robin style, and then the rifles would be cooled to ambient temp before shooting the next cold bore shot, repeating this until 10 rounds was fired from each. The hot barrel shots would be taken as quickly as possible and the ending temp recorded.

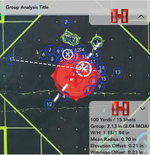
No group reduction techniques would be allowed- every round fired counted. Mean Point Of Impact would be the center of all rounds fired in a group no matter what shape or how ugly. Group size would be noted, but has no bearing for this test. Only the difference in mean point of impact or “zero” would. So too, whether the round hit point of aim or not is immaterial, as all groups would be measured using Hornady’s Grouo Analysis tool which gives deviation from aimpoint.

The scopes would be set on the highest magnification or max 20x if they went higher. Fixed scopes were what they were.


The rifles were as follows-

1). Unknown Munituons Competition 7PRC braked, in XLR chassis with NF NX8 4-32x scope. UM ammo.

2). Tikka Varmint T3x 6.5cm suppressed, in a McMillan Game Warden 2.0 stock, with NF NX8 4-32x scope. UM ammo.

3). Unknown Munitions 6.5 SUAM Imp, suppressed, in a Manners LRH stock, with NF NX8 4-32x scope. UM. ammo.

4). Factory T3 lite 308 in Stocky’s VG stock, suppressesd, with SWFA 10x scope. Hornady Black 155gr AMAX ammo.

5). Gunwerks Nexus 6.5 PRC, suppressed, with NF NX8 4-32x. Hornady 143gr ELD-X ammo.

6). Factory Tikka T3 223, suppressed, with SWFA fixed 6x scope. UM Ammo.

7). Tikka Tac 308win in KRG Bravo chassis, braked, with Bushnell Match Pro scope. Hornady Black 155gr AMAX ammo.

8). Tikka T3 Lite 223, suppressed, with SWFA fixed 6x scope. UM ammo.

9). Sako S20 6.5 CM, suppressed, with Trijicon Tenmile 3-18x44mm scope. UM ammo.

10). Tikka M595 Master Sporter 6XC, suppressed, with Minox ZP5 5-25x56mm scope. 115gr DTAC ammo.


Results:

Each target has the 10x cold bore shots on the left, and 10x hot barrel shots on the right.


Gun #1 no shift cold to hot.
View attachment 599436


Deviation between cold and hot was .21” elevation, and .16” windage. Well inside statistical variation.


Gun #2 no shift cold to hot:
View attachment 599437

Deviation between cold and hot centers was .28” elevation, and .07” windage. Well inside statistical variation.


Gun #3 no shift cold to hot:
View attachment 599438

Deviation between cold and hot was 0.0” elevation, and .13” windage. Well inside statistical variation.


Gun #4 shifted .52” in elevation, .13” windage with an asterisk.

View attachment 599439

Somewhere around shot 5 or 7 of the hot barrel group a loud “ting” was heard, and the gun recoiled noticeably more than usual. Firing stopped, the rifle was unloaded and was checked for a baffle strike. Suppressor was fine and nothing could be found. Firing resumed with a noticeable shift down in the group following the event, and the same noticeable difference in recoil.
The next day after further shooting and checking it, it was found that the action screws had loosened substantially. Once retorqued the rifle performed as normal. No shifts could be noticed.


Gun #5 no shift cold to hot.
View attachment 599440

Cold and initial hot group were different enough that a third group was fired to confirm. The rifle just doesn’t particularly like the ammo. The third 10 round group landed smack in the middle of the first two, filling in the cone.


Gun #6 no shift cold to hot:
View attachment 599441


Deviation from cold to hot was .03” elevation and .29” windage. Well inside statistical variation.


Gun #7 no shift cold to hot:
View attachment 599442


Deviation between cold and hot was .12” elevation and .11” windage. Well inside statistical variation. The rifle does not shoot this ammo well.


Gun #8 no shift cold to hot:
View attachment 599443


Deviation from cold to hot was .36” elevation and .04” windage. Well inside statistical variation for this rifle. Of note, this was with a fixed 6x scope and these are the two best 10 round groups this rifle has ever produced. It normally is around 1.1 to 1.2 MOA for ten rounds. It also has more than 20k rounds in this barrel without ever being cleaned.


Gun #9 no shift cold to hot:
View attachment 599445

#9 started the hot group with the turret accidentally dialed .1 mil up in elevation (top right). A second hot group was fired (bottom left) and the deviation in elevation from cold to hot was .32”. and .03” in windage.


Gun #10 no shift from cold to hot:
View attachment 599446

Deviation from cold to hot was .06” in elevation and .07” in windage. Well inside statistical variation.

Cont….
100 round groups are more statistically signicative
 
Last edited:

Latest posts

Featured Video

Stats

Threads
349,131
Messages
3,676,928
Members
79,863
Latest member
thehook1
Back
Top