Dos Perros
WKR
- Joined
- Jul 30, 2015
- Location
- Lenexa, KS
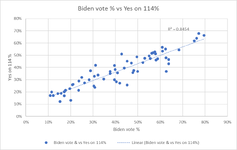
For reasons that don't matter I was curious to see the correlation between the percentage of Coloradoans that voted for Biden and compare it to the percentage of Coloradoans that voted for Proposition 114 (the wolf bill). Each dot represents an individual county in Colorado. As you can see there appears to be a very tight correlation (an r-squared value above 0.7 is regarded 'highly correlated'). I think we all knew this already. Anyway, this post is worth what you paid for it I guess.


